- Moving the markets
The Fed decided to hold off on raising interest rates this month, despite signs of inflation in the economy. This was good news for traders who were hoping for a pause in the Fed’s tightening cycle. But it also raised some questions about the Fed’s credibility and its ability to fight inflation in the future.
The market got a hint of the Fed’s decision earlier in the day when the Producer Price Index (PPI) came in lower than expected. The PPI measures the change in prices of goods and services sold by producers. It fell by 0.3% in May, compared to a forecast of a 0.1% drop. This brought the annual PPI down to 1.1%, the lowest since December 2020.
This suggested that inflation pressures were easing, or at least not as bad as feared. Traders took this as a sign that the Fed would not hike rates this month, but rather wait and see how the economy evolves. They were right.
In its statement, the Fed said that it would keep its benchmark rate in the 5%-5.25% range, and that any further rate hikes would depend on the economic data. It also added a new sentence, saying that holding rates steady would allow it to assess more information and its implications for monetary policy.
The Fed also said that it was prepared to adjust its policy stance if risks emerged that could impede its goals of price stability and maximum employment. This was a subtle way of saying that it could cut rates if inflation fell too low or if the economy slowed down significantly.
The Fed’s message was clear: it was not done with hiking rates, but it was not in a hurry either. It was taking a “hawkish pause”, as ZeroHedge put it.
However, not everyone was convinced by the Fed’s logic. Some analysts pointed out that the Fed was ignoring other indicators of inflation, such as consumer prices, wages, and oil prices. They also noted that the Fed was losing credibility by changing its tone from a “dovish hike” in May to a “hawkish pause” in June.
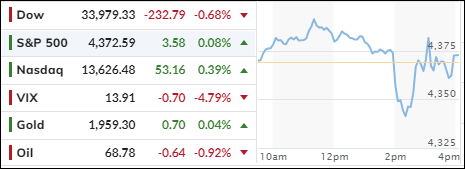
The market reaction was mixed. Stocks initially sold off, but then recovered and ended near flat. Gold also dipped, but then bounced back. Bonds and the dollar fell and stayed low. The Nasdaq was the best performer among the major indexes, as tech stocks benefited from lower interest rates.
This chart shows the divergence between the Nasdaq and the financial conditions index, which measures how easy or hard it is to borrow money in the market. The index has been rising, indicating tighter financial conditions, while the Nasdaq has been soaring, indicating optimism.
This disconnect suggests that either the Nasdaq is too optimistic, or the financial conditions index is too pessimistic. Either way, something has to give.
The market will be watching closely how the economy performs in the coming months, and how the Fed responds to new data. Will inflation prove to be transitory or persistent? Will growth remain strong or falter? Will the Fed stick to its pause or resume its hikes?
These are the questions that will determine the direction of the market in the second half of 2023.
- “Buy” Cycle Suggestions
The current Buy cycle began on 12/1/2022, and I gave you some ETF tips based on my StatSheet back then. But if you joined me later, you might want to check out the latest StatSheet, which I update and post every Thursday at 6:30 pm PST.
You should also think about how much risk you can handle when picking your ETFs. If you are more cautious, you might want to go for the ones in the middle of the M-Index rankings. And if you don’t want to go all in, you can start with a 33% exposure and see how it goes.
We are in a crazy time, with the economy going downhill and some earnings taking a hit. That will eventually drag down stock prices too. So, in my advisor’s practice, we are looking for some value, growth and dividend ETFs that can weather the storm. And of course, gold is always a good friend.
Whatever you invest in, don’t forget to use a trailing sell stop of 8-12% to protect yourself from big losses.
- Trend Tracking Indexes (TTIs)
The Fed’s decision to hold interest rates steady did not calm the market, as investors were spooked by the Fed’s hawkish tone. The Fed stressed that inflation was still its top priority, and that it was ready to raise rates again if needed.
This dashed the hopes of those who expected a more dovish stance from the Fed. The market reacted with volatility, as stocks swung between gains and losses. The bond market also suffered, as yields rose on inflation fears.
The Fed’s pause may not last long, as the economy faces more headwinds from higher borrowing costs and lower consumer spending. The market may soon face the reality of a slowing growth and rising inflation environment, which could drag our TTIs back into bear territory.
This is how we closed 06/14/2023:
Domestic TTI: +3.78% above its M/A (prior close +3.97%)—Buy signal effective 12/1/2022.
International TTI: +8.67% above its M/A (prior close +7.89%)—Buy signal effective 12/1/2022.
All linked charts above are courtesy of Bloomberg via ZeroHedge.
Contact Ulli