
- Moving the markets
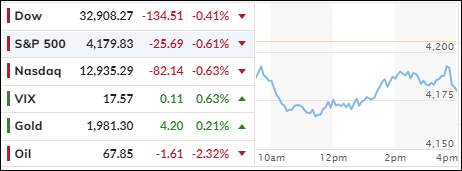
Wall Street was in a gloomy mood today as the debt ceiling deal faced uncertainty and opposition in Congress. The House Rules Committee approved the deal, but the final vote will take place tonight at 8:30pm EST. The major indexes stayed in the red all day, despite a late rally that trimmed some losses.
Investors are wondering if the deal will pass in time to avoid a default, or if more negotiations and delays are ahead. Some lawmakers have expressed their dissent, which could jeopardize the whole process.
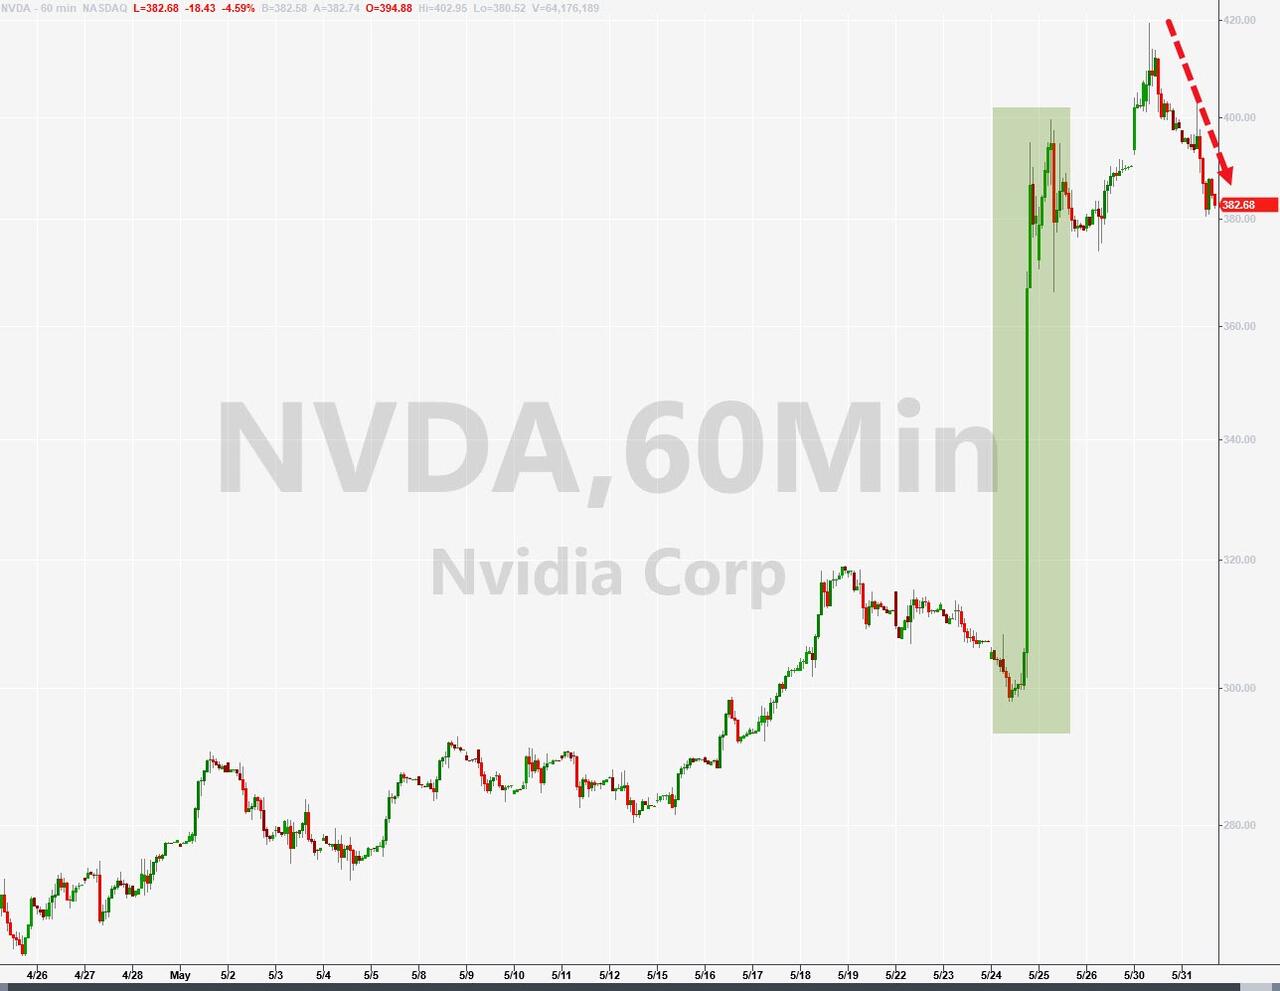
The month of May was a mixed bag for the market. The S&P 500 barely gained +0.26%, the Dow lost over 3%, but the Nasdaq soared by 6%. However, this performance was driven by a few tech giants, like Nvidia, which surged 40% in May but fell 10% yesterday.
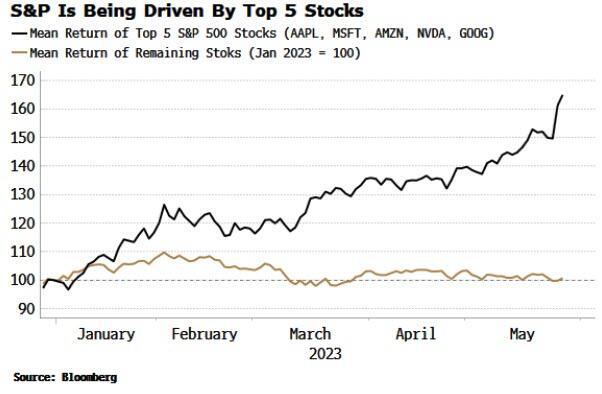
The market’s strength was too narrow and uneven. The top five S&P stocks averaged a whopping 50% mean return this year, while the rest of the 495 stocks were flat. This does not reflect a healthy bull market, but rather a bear market rally.
Adding to the bearish sentiment were some conflicting signals from the Fed officials. Some of them hinted at raising rates sooner to curb inflation, while others suggested pausing or skipping rate hikes to see more data. The Fed’s stance was as clear as mud.
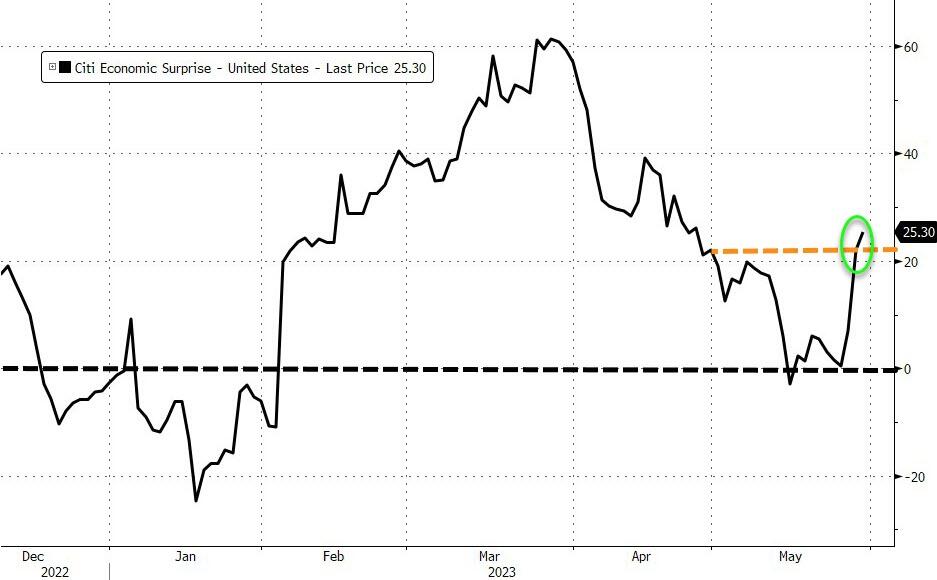
On the economic front, we saw a sharp drop in the Chicago PMI, but a strong increase in job openings in April. The Citi Economic Surprise index bounced back in May.
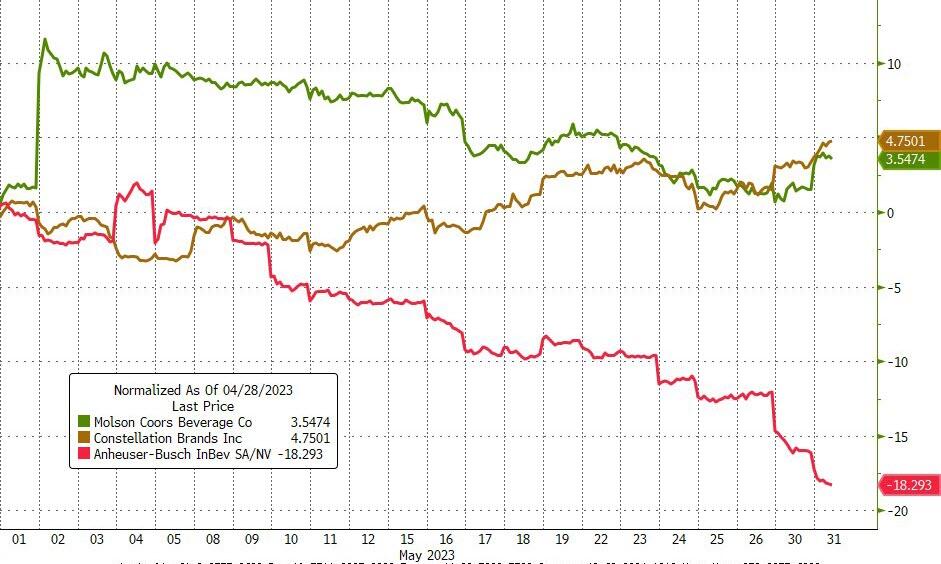
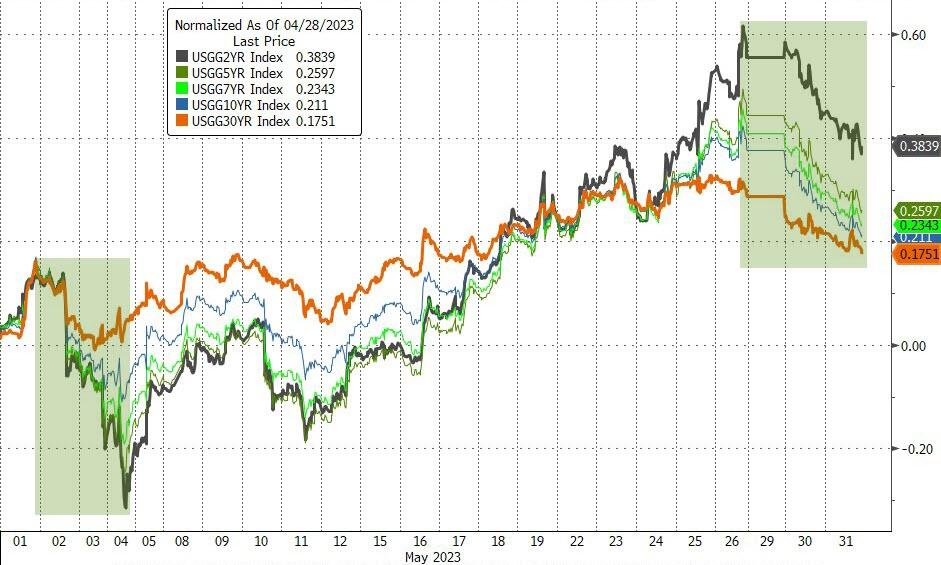
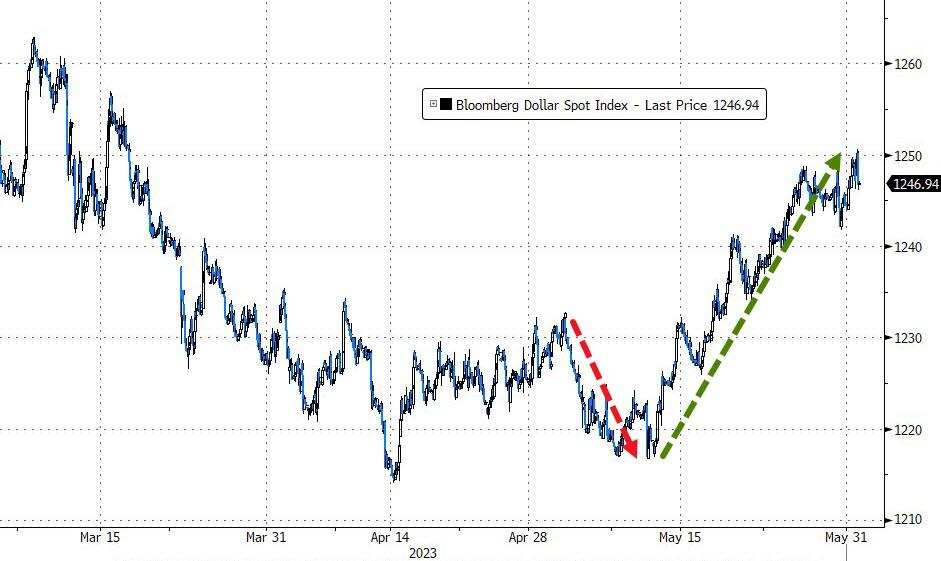
Some notable stocks that suffered in May were Budweiser and Target. Bond yields and the US dollar rose, while gold slipped below $2k but held above its March lows.
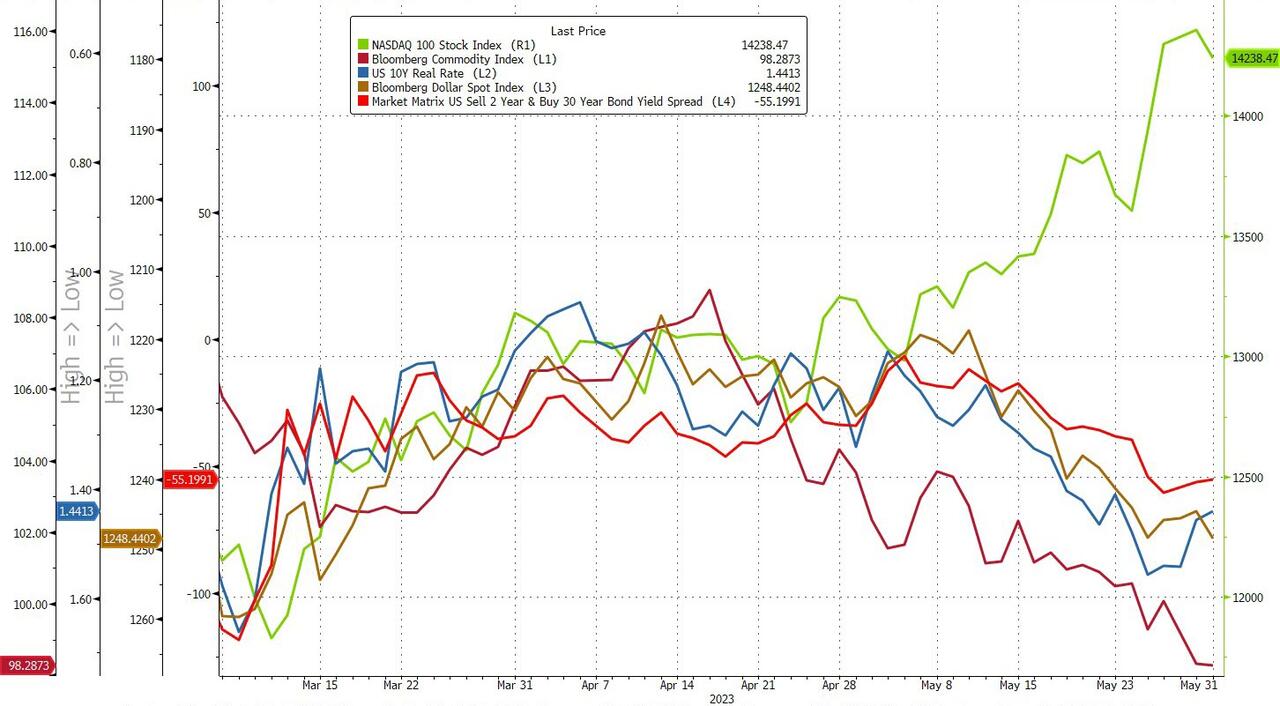
The market is facing a divergence between commodities, real yields, and the dollar on one hand, and the tech frenzy fueled by AI on the other. How long can this gap last?
- “Buy” Cycle Suggestions
The current Buy cycle began on 12/1/2022, and I gave you some ETF tips based on my StatSheet back then. But if you joined me later, you might want to check out the latest StatSheet, which I update and post every Thursday at 6:30 pm PST.
You should also think about how much risk you can handle when picking your ETFs. If you are more cautious, you might want to go for the ones in the middle of the M-Index rankings. And if you don’t want to go all in, you can start with a 33% exposure and see how it goes.
We are in a crazy time, with the economy going downhill and some earnings taking a hit. That will eventually drag down stock prices too. So, in my advisor’s practice, we are looking for some value, growth and dividend ETFs that can weather the storm. And of course, gold is always a good friend.
Whatever you invest in, don’t forget to use a trailing sell stop of 8-12% to protect yourself from big losses.
- Trend Tracking Indexes (TTIs)
Our TTIs dropped with especially the International one taking a big hit from yesterday’s close. The outcome of the debt ceiling debacle will most likely give us a better idea as to future market direction and if a potential domestic “Sell” signal is warranted.
This is how we closed 05/31/2023:
Domestic TTI: -1.48% below its M/A (prior close -0.61%)—Buy signal effective 12/1/2022.
International TTI: +2.82% above its M/A (prior close +4.23%)—Buy signal effective 12/1/2022.
All linked charts above are courtesy of Bloomberg via ZeroHedge.
Contact Ulli