
- Moving the markets
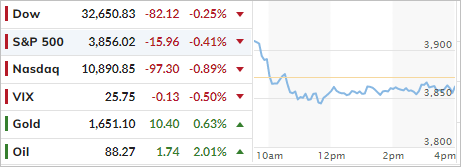
After an early bounce, the major indexes faded below their respective trend lines and spent the session aimlessly meandering in anticipation of the Fed’s decision on interest rates tomorrow.
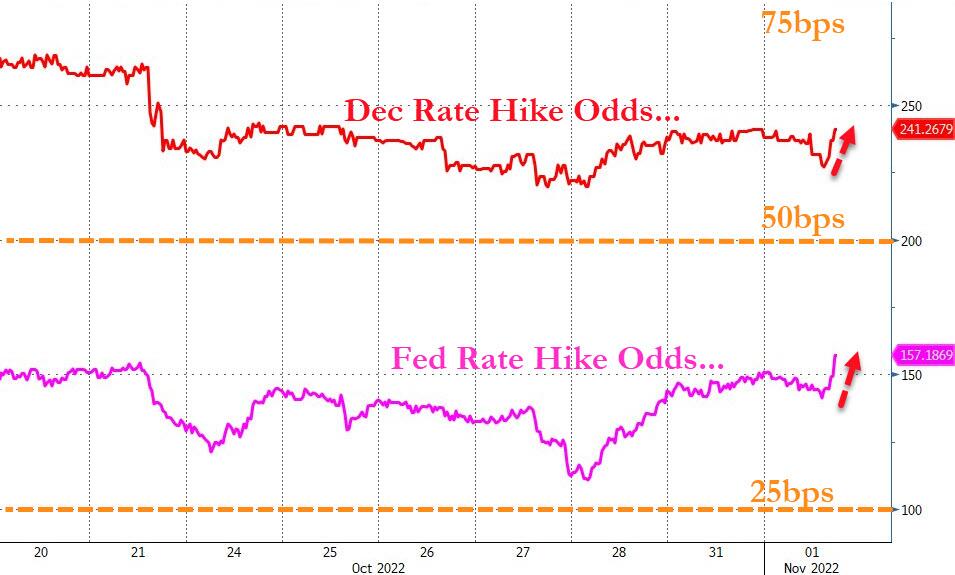
As I posted before, a hike of 75bps is pretty much a lock, but the much-anticipated question as to what they will do in December may not be answered. However, last month’s rally was based on traders’ assumption the Fed might pull back next month and only hike 50bps.
Should that happen, the current rally has a good chance of continuing, however, if the hawkish sentiment prevails to better fight inflation via another 75bps increase, a sell-off will be in the cards.
Given today’s stronger than expected jobs data, Fed head Powell may not cave as quickly as had been assumed and wave the torch of higher rates a while longer, as today’s terminal rate expectations chart seems to indicate—as do the December rate hike odds.
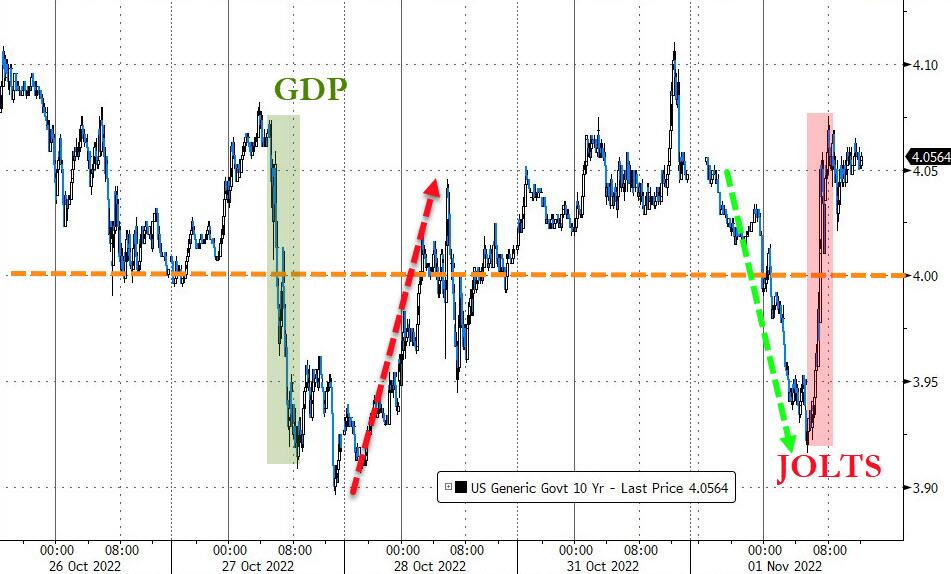
Bond yields were in a world of their own by first tanking and then ripping higher after the jobs report was released. The 10-year followed suit by dumping and pumping.
All eyes are now the Fed, and yesterday’s question, as to whether we will see a three-peat, may be answered, if not tomorrow, but likely over the next few trading days.
2. ETFs in the Spotlight
In case you missed the announcement and description of this section, you can read it here again.
It features some of the 10 broadly diversified domestic and sector ETFs from my HighVolume list as posted every Saturday. Furthermore, they are screened for the lowest MaxDD% number meaning they have been showing better resistance to temporary sell offs than all others over the past year.
The below table simply demonstrates the magnitude with which these ETFs are fluctuating above or below their respective individual trend lines (%+/-M/A). A break below, represented by a negative number, shows weakness, while a break above, represented by a positive percentage, shows strength.
For hundreds of ETF choices, be sure to reference Thursday’s StatSheet.
For this closed-out domestic “Buy” cycle (2/24/2022), here’s how some of our candidates have fared. Keep in mind that our Domestic Trend Tracking Index (TTI) signaled a “Sell” on that date, which overrode the existing “Buys” shown for SPY and IYM:
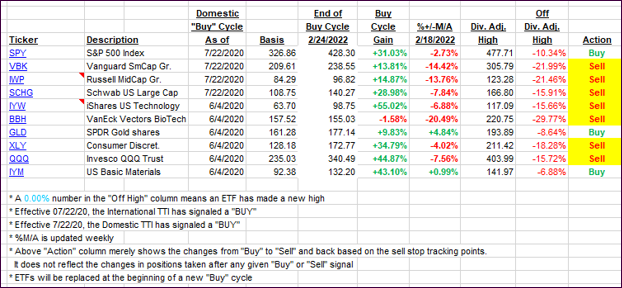
Click image to enlarge.
Again, the %+/-M/A column above shows the position of the various ETFs in relation to their respective long-term trend lines, while the trailing sell stops are being tracked in the “Off High” column. The “Action” column will signal a “Sell” once the -12% point has been taken out in the “Off High” column, which has replaced the prior -8% to -10% limits.
3. Trend Tracking Indexes (TTIs)
Our TTIs moved a smidgen higher despite the market sentiment being bearish.
This is how we closed 11/01/2022:
Domestic TTI: -2.69% below its M/A (prior close -2.92%)—Sell signal effective 02/24/2022.
International TTI: -6.82% below its M/A (prior close -7.59%)—Sell signal effective 03/08/2022.
Disclosure: I am obliged to inform you that I, as well as my advisory clients, own some of the ETFs listed in the above table. Furthermore, they do not represent a specific investment recommendation for you, they merely show which ETFs from the universe I track are falling within the specified guidelines.
All linked charts above are courtesy of Bloomberg via ZeroHedge.
Contact Ulli