
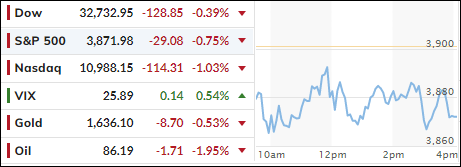
- Moving the markets
During the month of September, the S&P 500 tanked and lost -9.3% with the index meandering sideways for the first 12 days of October. Suddenly, a slow climb out of that deep hole gathered momentum with all major indexes staging a remarkable bear market bounce that stopped just short of generating a new “Buy” signal for us trend followers.
For October, the S&P gained 8%, thereby recouping a big chunk of September’s losses but falling short in magnitude of June/July’s bounce back. Still, the Ramp-A-Thon occurred despite a mixed 3rd quarter earnings season, during which the big names in the tech sector simply got wrecked with the downside “leaders” being Amazon and Facebook.
With a “so-so” earnings season, a slowing economy and worsening inflation everywhere you look, what caused this sudden change in sentiment from bearish to bullish?
The answer is found in the same old standby argument, namely that traders and analysts are absolutely convinced and ever hopeful for a Fed pivot (to at least a pause or a reduction in rate hikes), which is currently defined as a +75bps increase this coming Wednesday followed by only a +50bps hike in December.
It is critical that this plan will fall into place exactly like this, because should the Fed move +75bps in December, disappointment will reign, and you can kiss this current rally goodbye with new YTD lows likely being on the horizon.
Everything is measured in odds, and Wednesday’s forecast of a 75bps hike is a 100% lock, while the graph shows that the odds of a 75bps move have gotten more hawkish (40%).
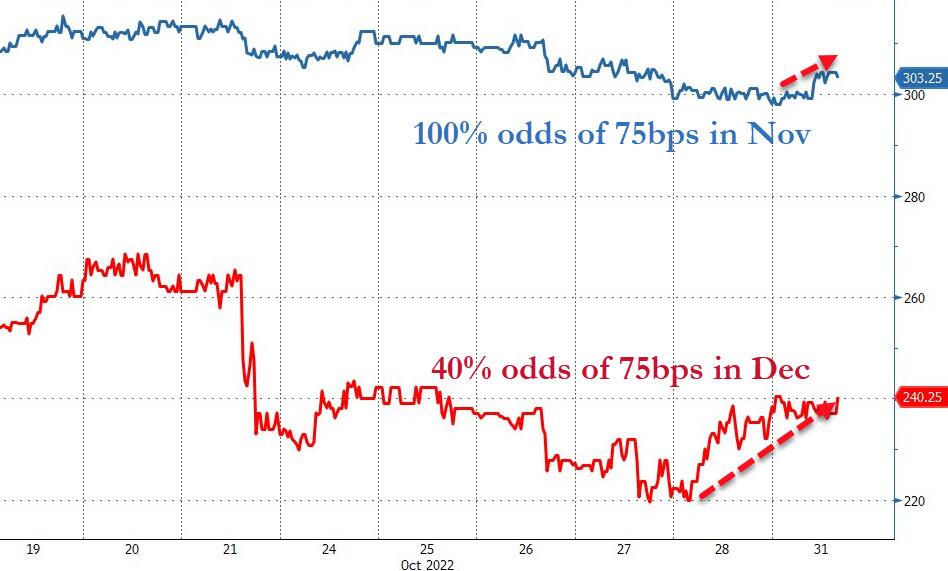
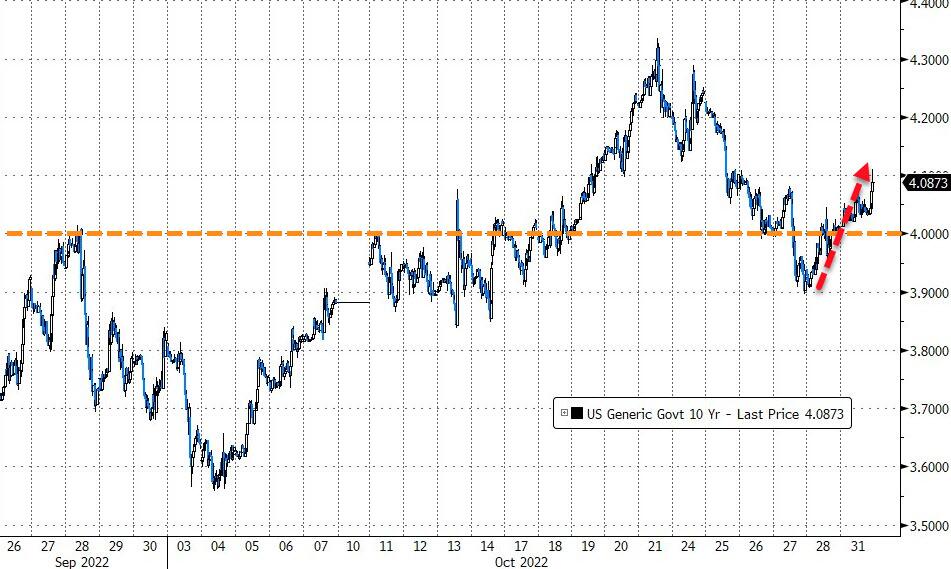
Bond yields rose throughout the month, while prices tanked. The 10-year managed to cross the 4% level and meandered around that number yet managed to close above it.
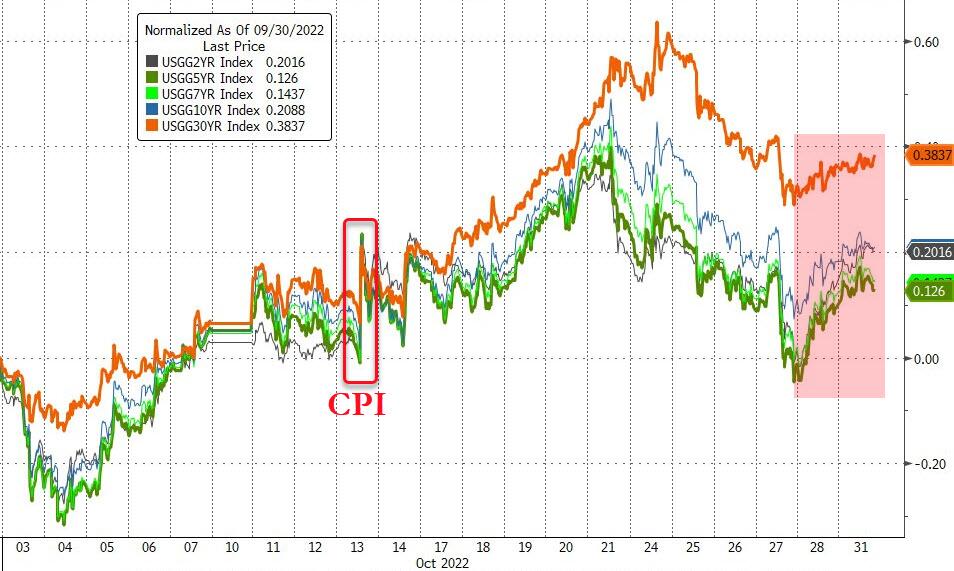
As ZeroHedge points out, this pattern of stocks ramping on “pivot/pause” hope, while rates were rising, has not worked out well for the markets this year, as this chart shows.
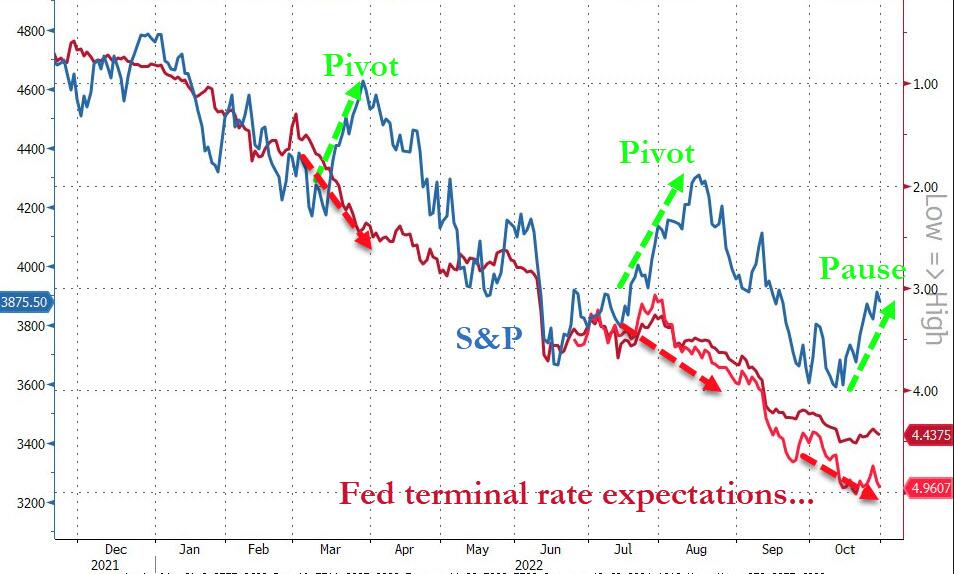
Will we see a three-peat?
2. ETFs in the Spotlight
In case you missed the announcement and description of this section, you can read it here again.
It features some of the 10 broadly diversified domestic and sector ETFs from my HighVolume list as posted every Saturday. Furthermore, they are screened for the lowest MaxDD% number meaning they have been showing better resistance to temporary sell offs than all others over the past year.
The below table simply demonstrates the magnitude with which these ETFs are fluctuating above or below their respective individual trend lines (%+/-M/A). A break below, represented by a negative number, shows weakness, while a break above, represented by a positive percentage, shows strength.
For hundreds of ETF choices, be sure to reference Thursday’s StatSheet.
For this closed-out domestic “Buy” cycle (2/24/2022), here’s how some of our candidates have fared. Keep in mind that our Domestic Trend Tracking Index (TTI) signaled a “Sell” on that date, which overrode the existing “Buys” shown for SPY and IYM:
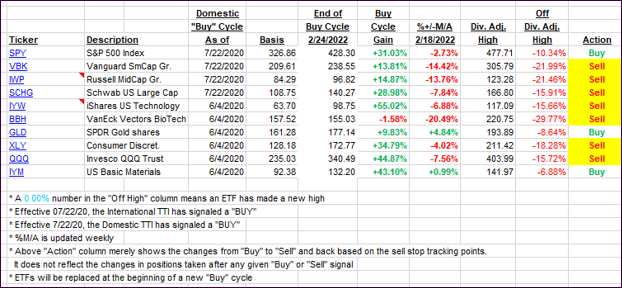
Click image to enlarge.
Again, the %+/-M/A column above shows the position of the various ETFs in relation to their respective long-term trend lines, while the trailing sell stops are being tracked in the “Off High” column. The “Action” column will signal a “Sell” once the -12% point has been taken out in the “Off High” column, which has replaced the prior -8% to -10% limits.
3. Trend Tracking Indexes (TTIs)
Our TTIs pulled back a tad, as the markets meandered directionless ahead of the Fed’s decision on interest rates this Wednesday.
This is how we closed 10/31/2022:
Domestic TTI: -2.92% below its M/A (prior close -2.49%)—Sell signal effective 02/24/2022.
International TTI: -7.59% below its M/A (prior close -7.17%)—Sell signal effective 03/08/2022.
Disclosure: I am obliged to inform you that I, as well as my advisory clients, own some of the ETFs listed in the above table. Furthermore, they do not represent a specific investment recommendation for you, they merely show which ETFs from the universe I track are falling within the specified guidelines.
All linked charts above are courtesy of Bloomberg via ZeroHedge.
Contact Ulli