
- Moving the markets
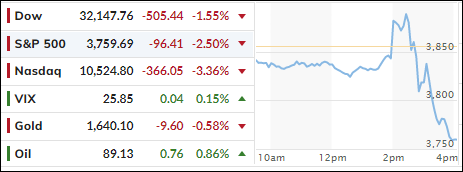
Despite the Fed doing the expected, namely hiking rates another 75bps and hinting at a policy change in the future, eliciting bullish momentum at first, things went the opposite way after Powell suggested that “the ultimate level of interest rates will be higher than previously expected.”
The overall tone of the FOMC statement was hawkish, which translates into the Fed needing more time to fight inflation with no hints of dovishness that a pause could be a possibility in the future. And just like that, the early feel-good bounce was wiped out, and south we went, with the major indexes diving into the close.
Among a host of comments by Powell, this one left no doubt as to how he sees the current economic environment:
The question of when to moderate the pace of increases is now much less important than the question of how high to raise rates and how long to keep monetary policy restrictive.
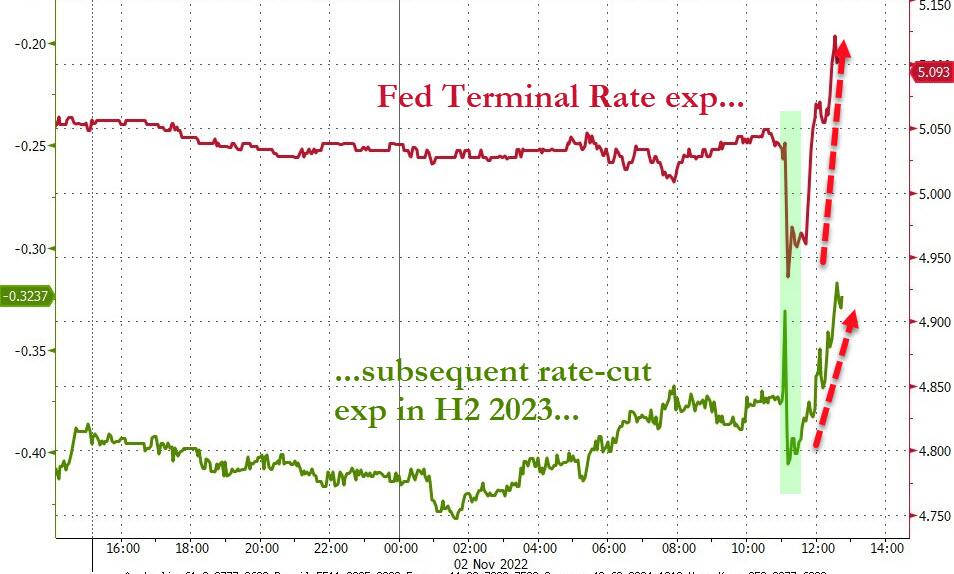
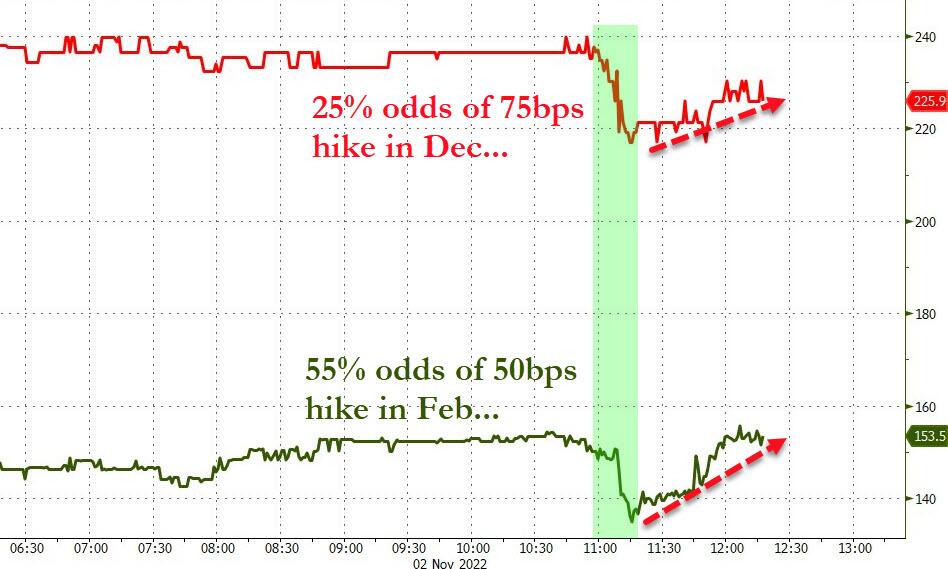
The immediate effect was that Terminal Rate Expectations surged further into hawkish territory, with Rate Cut Expectations following the same path, as the odds for further hikes increased. As a result, SmallCaps and the Nasdaq puked over 3%, as ZeroHedge pointed out.
And then this:
*POWELL: IF WE OVERTIGHTEN, WE CAN SUPPORT ECONOMIC ACTIVITY
*POWELL: IF WE UNDERTIGHTEN, RISK IS INFLATION ENTRENCHED
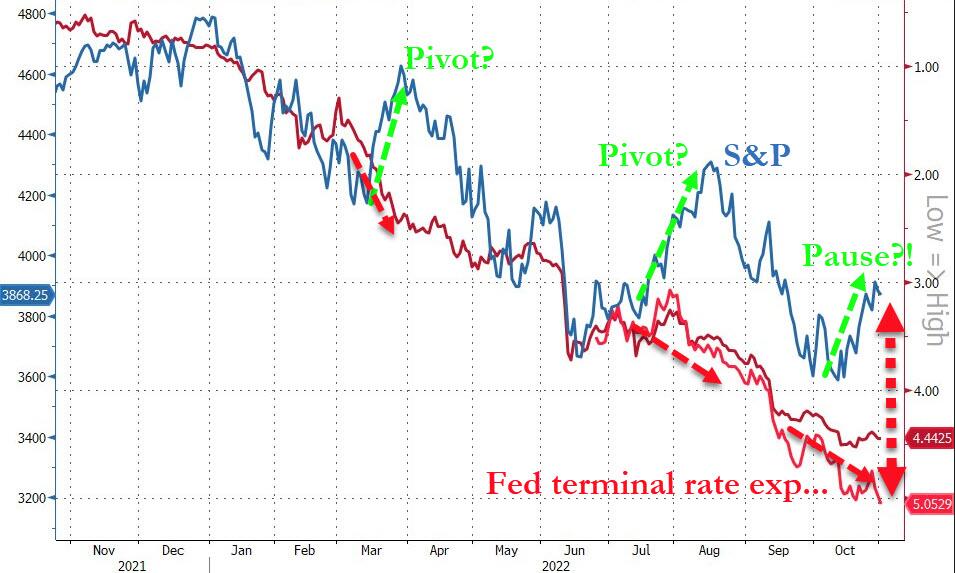
That should make it clear that a pause, let alone a pivot, is nowhere near on the horizon, which begs this question:
Will the October rally now turn into another dead-cat-bounce?
We will find out soon.
2. ETFs in the Spotlight
In case you missed the announcement and description of this section, you can read it here again.
It features some of the 10 broadly diversified domestic and sector ETFs from my HighVolume list as posted every Saturday. Furthermore, they are screened for the lowest MaxDD% number meaning they have been showing better resistance to temporary sell offs than all others over the past year.
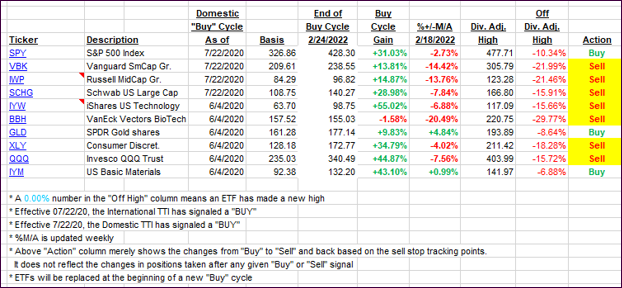
The below table simply demonstrates the magnitude with which these ETFs are fluctuating above or below their respective individual trend lines (%+/-M/A). A break below, represented by a negative number, shows weakness, while a break above, represented by a positive percentage, shows strength.
For hundreds of ETF choices, be sure to reference Thursday’s StatSheet.
For this closed-out domestic “Buy” cycle (2/24/2022), here’s how some of our candidates have fared. Keep in mind that our Domestic Trend Tracking Index (TTI) signaled a “Sell” on that date, which overrode the existing “Buys” shown for SPY and IYM:
Click image to enlarge.
Again, the %+/-M/A column above shows the position of the various ETFs in relation to their respective long-term trend lines, while the trailing sell stops are being tracked in the “Off High” column. The “Action” column will signal a “Sell” once the -12% point has been taken out in the “Off High” column, which has replaced the prior -8% to -10% limits.
3. Trend Tracking Indexes (TTIs)
Our TTIs took a dive with the major indexes, as Powell’s hawkishness seemed to have ended the current bounce back.
This is how we closed 11/02/2022:
Domestic TTI: -5.06% below its M/A (prior close -2.69%)—Sell signal effective 02/24/2022.
International TTI: -7.69% below its M/A (prior close -6.82%)—Sell signal effective 03/08/2022.
Disclosure: I am obliged to inform you that I, as well as my advisory clients, own some of the ETFs listed in the above table. Furthermore, they do not represent a specific investment recommendation for you, they merely show which ETFs from the universe I track are falling within the specified guidelines.
All linked charts above are courtesy of Bloomberg via ZeroHedge.
Contact Ulli