
- Moving the markets
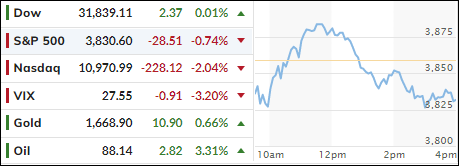
Despite an early 300-point jump in the Dow, the major indexes were not able to hang on to that euphoric start, as the reality set in that all is not well with Big Tech. Both, Alphabet and Microsoft shares got hammered, with the former missing earnings expectations on the top and bottom lines, while the latter reported weaker than expected cloud revenue.
That ended a three-day winning streak, as traders tried to balance the overall earnings picture with what it might mean for future interest rate hikes. Optimism that the Fed will pivot, should things deteriorate more quickly, has been the main driver for this current rebound.
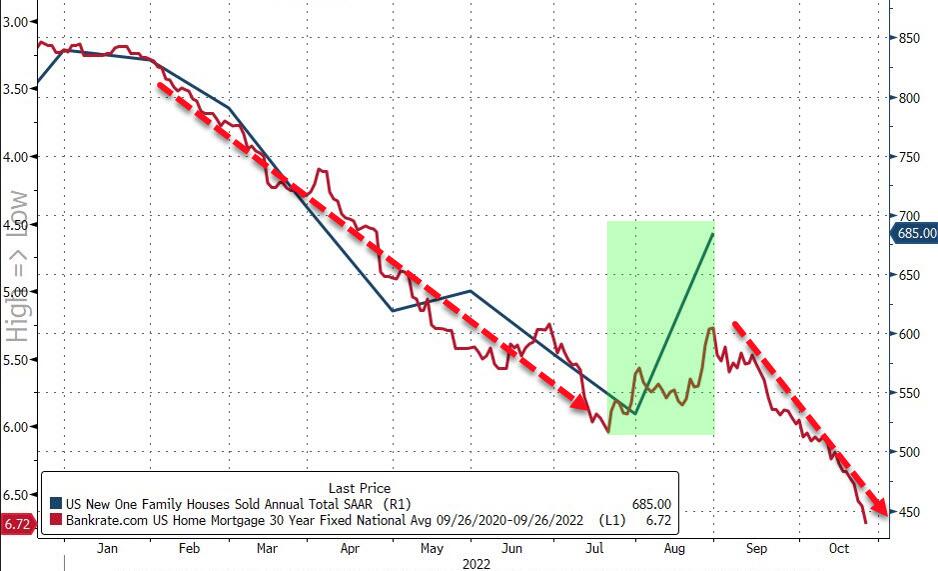
In terms of deterioration, housing appears take top billing when, after recent pessimistic reports, we learned today that New Home Sales plunged due to re-surging mortgage rates thereby wiping out the August “hope” bounce.
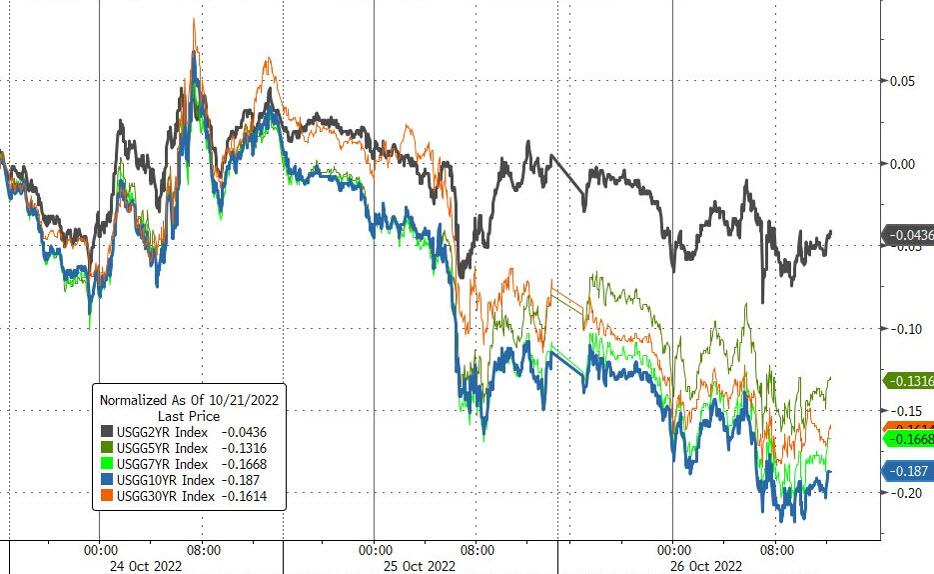
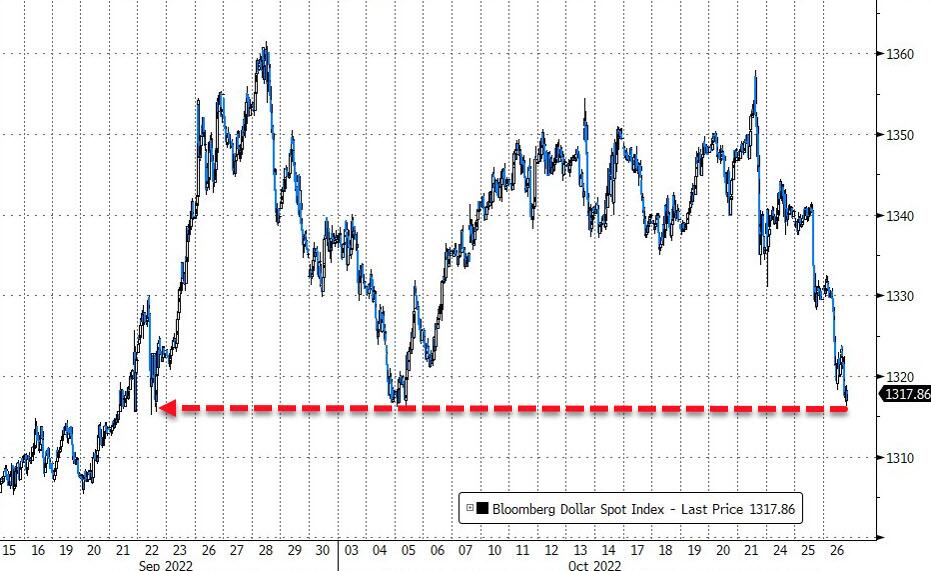
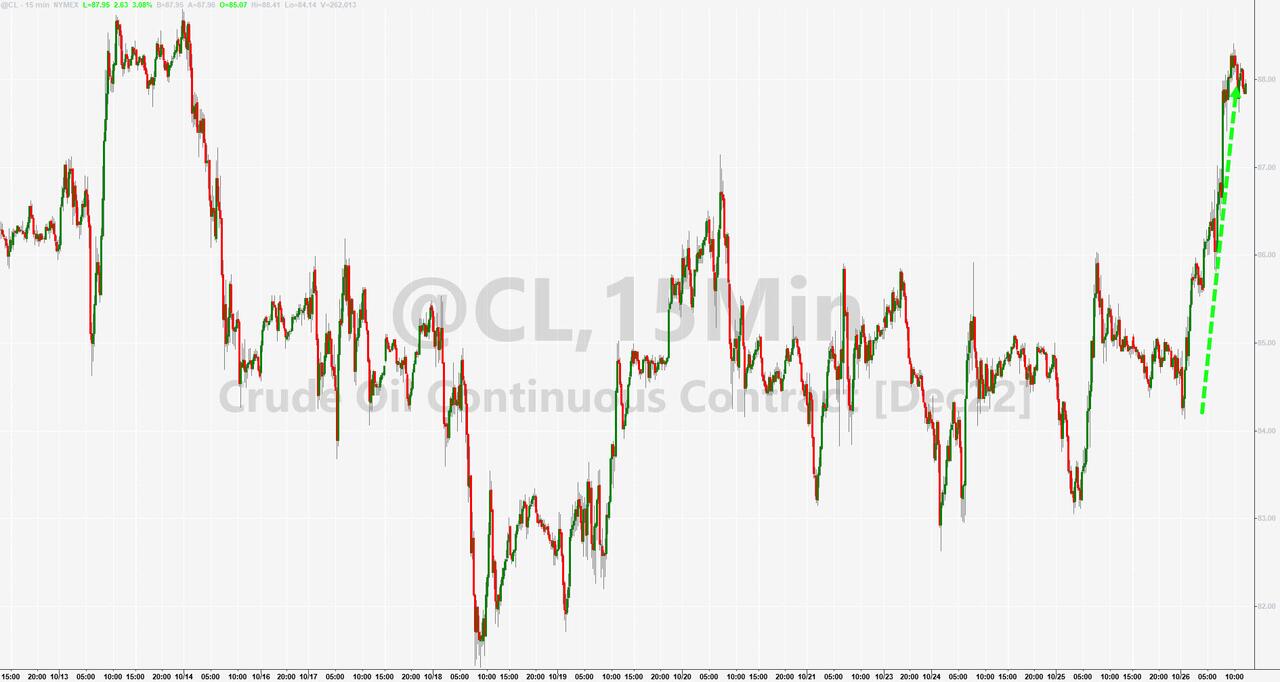
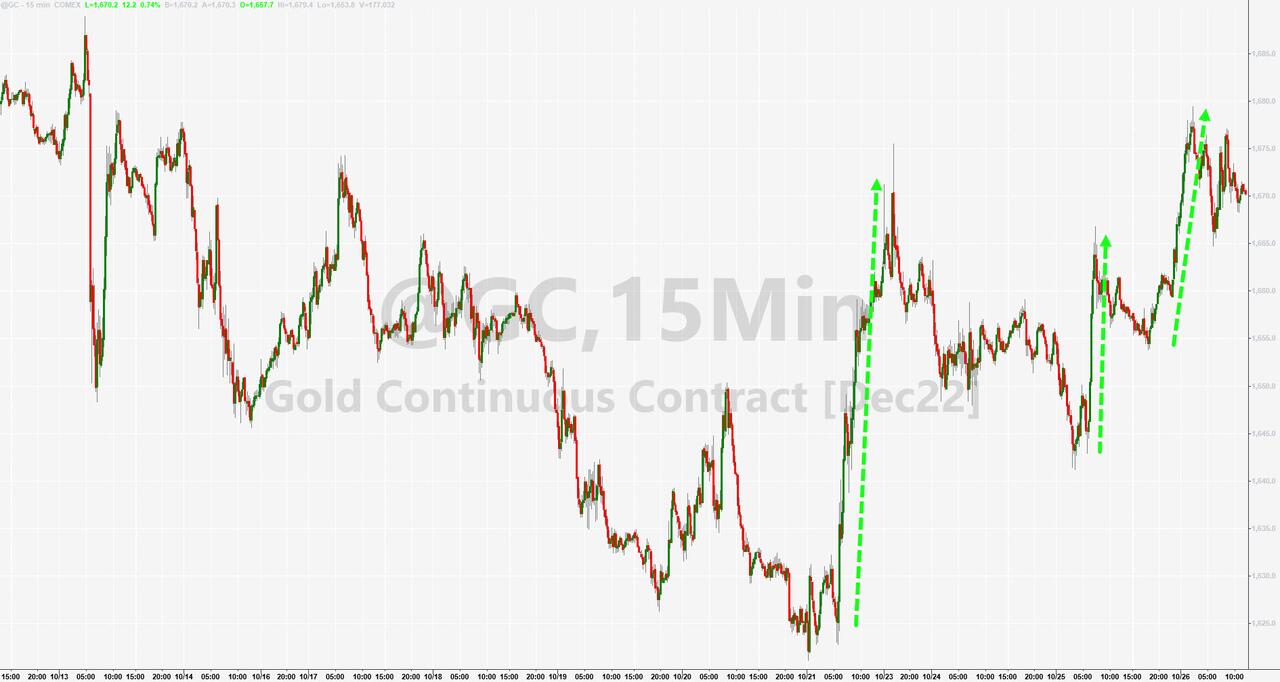
Looking at the big picture, we witnessed violent swings with the Chinese Yuan exploding higher, bond yields plunging, stocks pumping and dumping, the dollar getting clubbed, while crude oil and gold ramped higher.
And to be included in today’s confusion, former NY Fed President Bill Dudley called for the Fed to be hawkish for longer:
Emphasizing “longer” rather than “higher” has some advantages. It presumably reduces the risk of a hard landing: If monetary policy is somewhat tight, but not very tight, activity and employment should slow gradually. It gives Fed officials time to assess the consequences of their efforts, recognizing that monetary policy entails uncertainty and affects the economy with long and variable lags.
That said, the downside risks are significant. Because less-aggressive tightening takes longer to bring down inflation, it might allow inflationary expectations to become unanchored – a dynamic that only even-higher interest rates could counteract.
That, of course, puts a crimp in the dovish storyline that a pivot could be on the horizon, but then again, nobody can be sure about anything. We could see more follow through to the upside or a huge crash—take your pick.
2. ETFs in the Spotlight
In case you missed the announcement and description of this section, you can read it here again.
It features some of the 10 broadly diversified domestic and sector ETFs from my HighVolume list as posted every Saturday. Furthermore, they are screened for the lowest MaxDD% number meaning they have been showing better resistance to temporary sell offs than all others over the past year.
The below table simply demonstrates the magnitude with which these ETFs are fluctuating above or below their respective individual trend lines (%+/-M/A). A break below, represented by a negative number, shows weakness, while a break above, represented by a positive percentage, shows strength.
For hundreds of ETF choices, be sure to reference Thursday’s StatSheet.
For this closed-out domestic “Buy” cycle (2/24/2022), here’s how some of our candidates have fared. Keep in mind that our Domestic Trend Tracking Index (TTI) signaled a “Sell” on that date, which overrode the existing “Buys” shown for SPY and IYM:
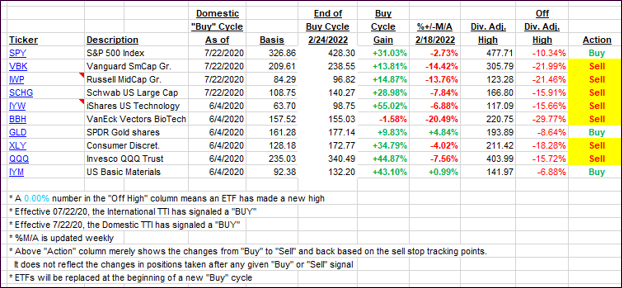
Click image to enlarge.
Again, the %+/-M/A column above shows the position of the various ETFs in relation to their respective long-term trend lines, while the trailing sell stops are being tracked in the “Off High” column. The “Action” column will signal a “Sell” once the -12% point has been taken out in the “Off High” column, which has replaced the prior -8% to -10% limits.
3. Trend Tracking Indexes (TTIs)
Our TTIs inched a tad closer to their respective trend lines, despite the massive downside turnaround in the markets.
This is how we closed 10/26/2022:
Domestic TTI: -4.76% below its M/A (prior close -4.94%)—Sell signal effective 02/24/2022.
International TTI: -8.02% below its M/A (prior close -8.81%)—Sell signal effective 03/08/2022.
Disclosure: I am obliged to inform you that I, as well as my advisory clients, own some of the ETFs listed in the above table. Furthermore, they do not represent a specific investment recommendation for you, they merely show which ETFs from the universe I track are falling within the specified guidelines.
All linked charts above are courtesy of Bloomberg via ZeroHedge.
Contact Ulli