
- Moving the markets
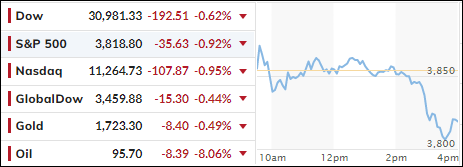
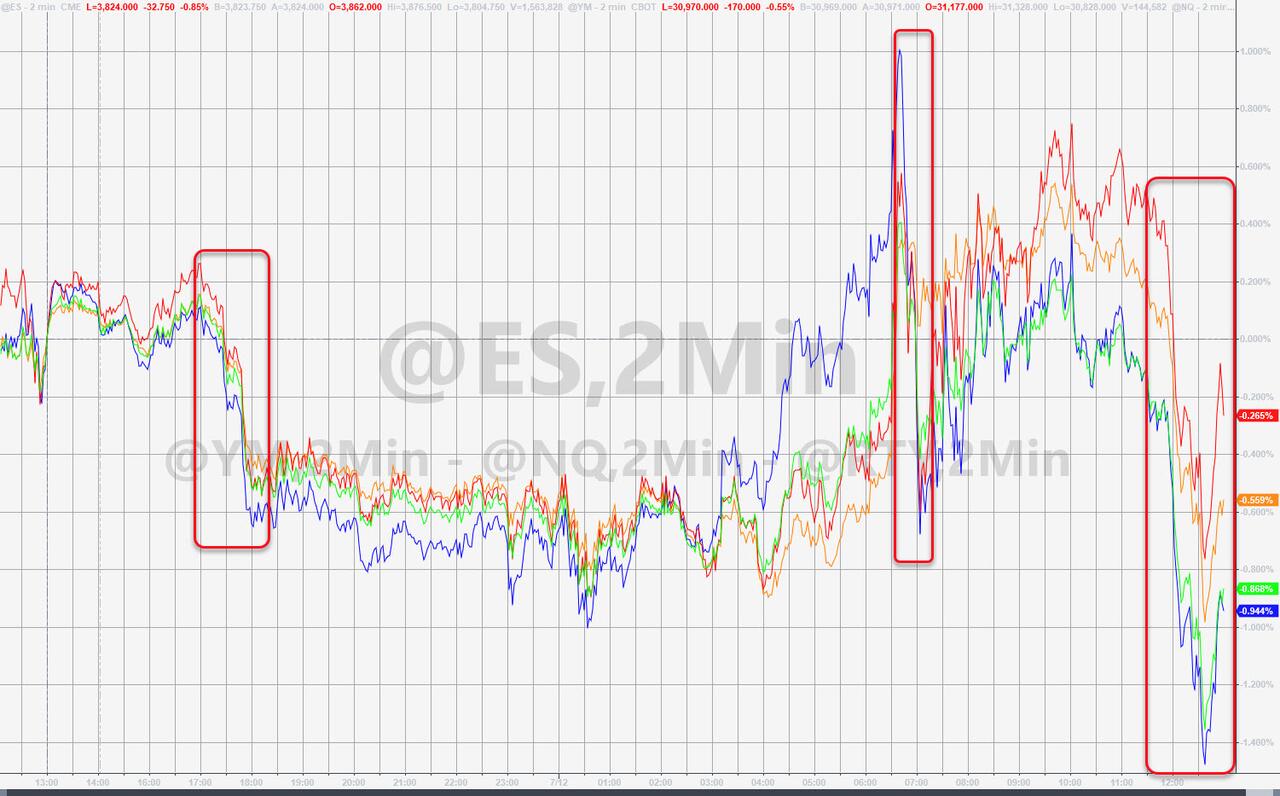
After hesitantly spending some time above their respective unchanged lines, bullish momentum, as insignificant as it was, disappeared, and the major indexes staged a turnaround and dumped into the close.
It was a lackluster session with the same old standby worry, namely economic growth, as Wall Street braced itself for tomorrows key inflation data via the release of the CPI. It’s no secret that growth is slowing, and Central Banks remain in inflation-fighting mode, which means more rate hikes.
The earnings season started well with PepsiCo’s report card and forward guidance turning out better than expected. Keep in mind though, that those businesses which do not pass on their higher input costs will have deal with squeezed profit margins, which will negatively affect their stock prices.
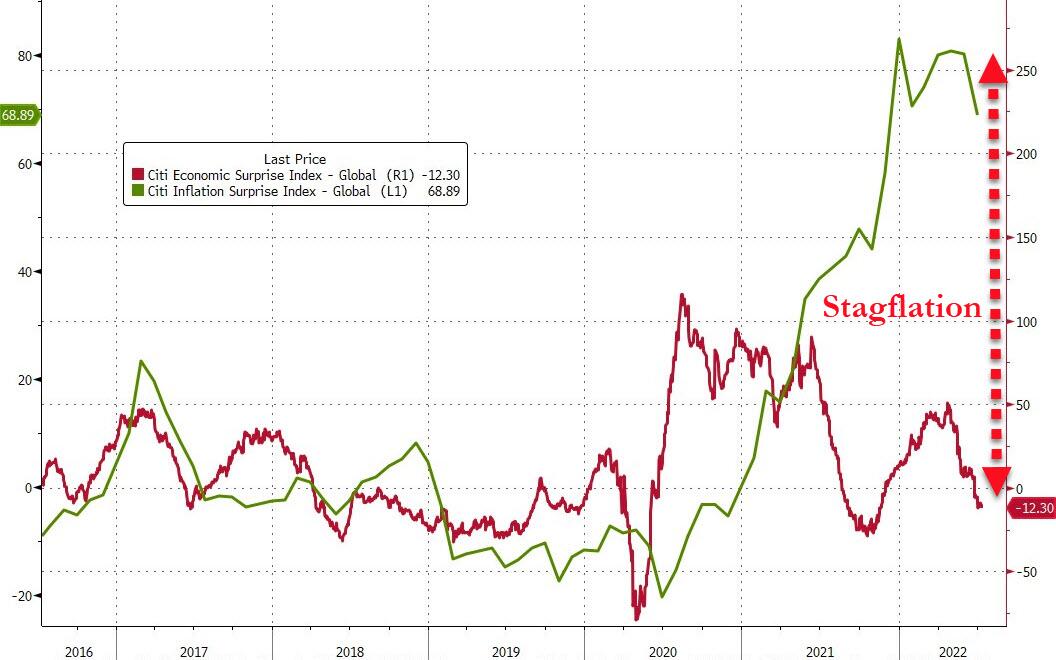
So far, the case for Stagflation remains on deck, as inflation is consistently hotter than expected and economic growth weaker than expected, according to ZeroHedge.
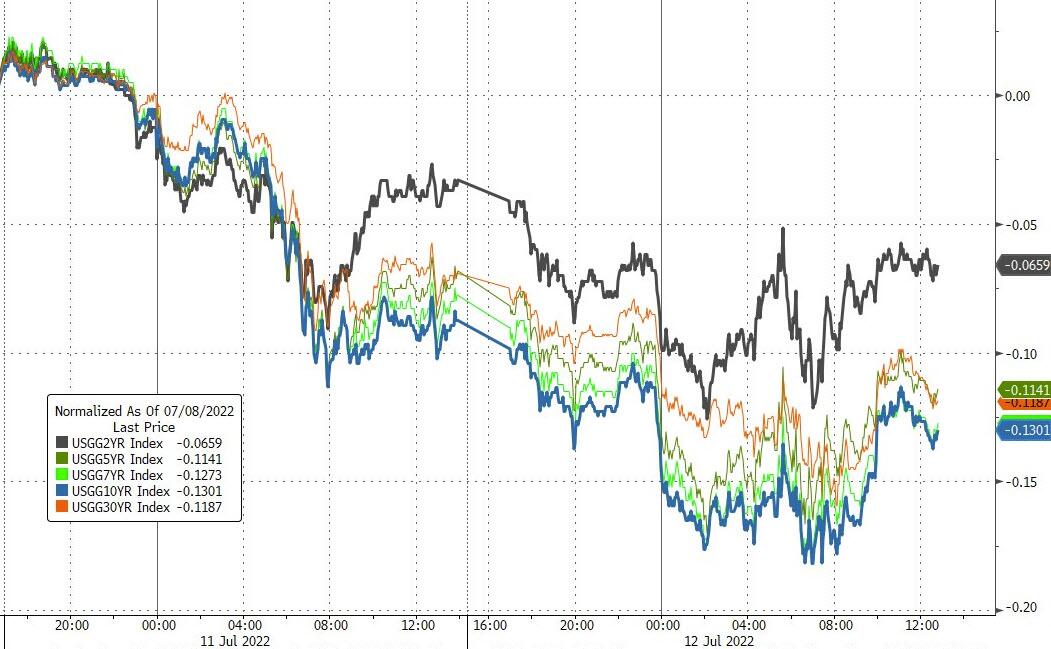
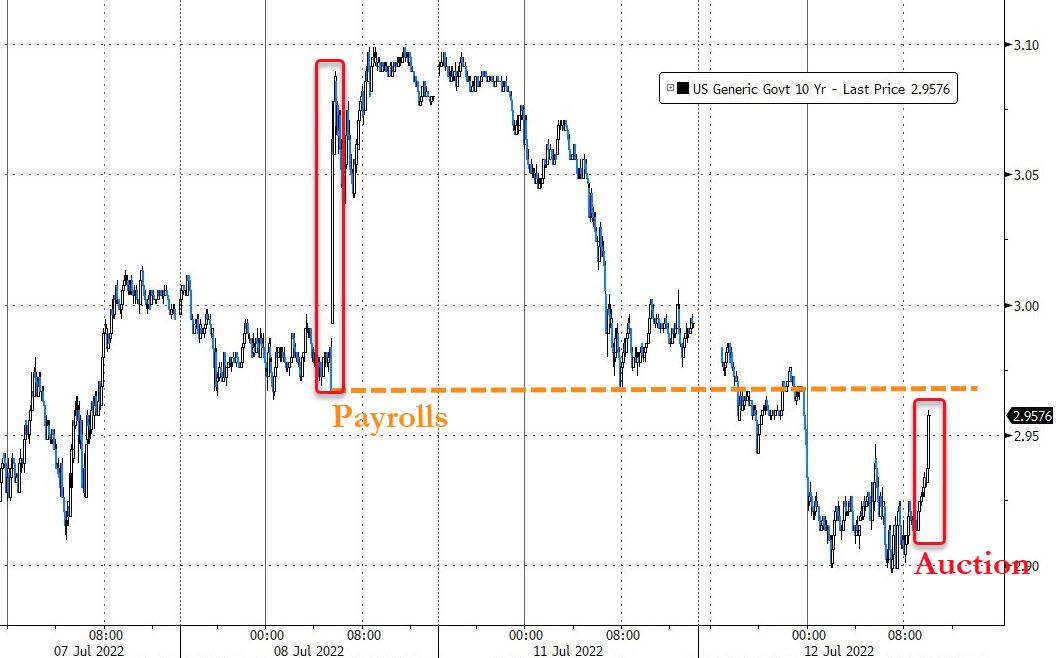
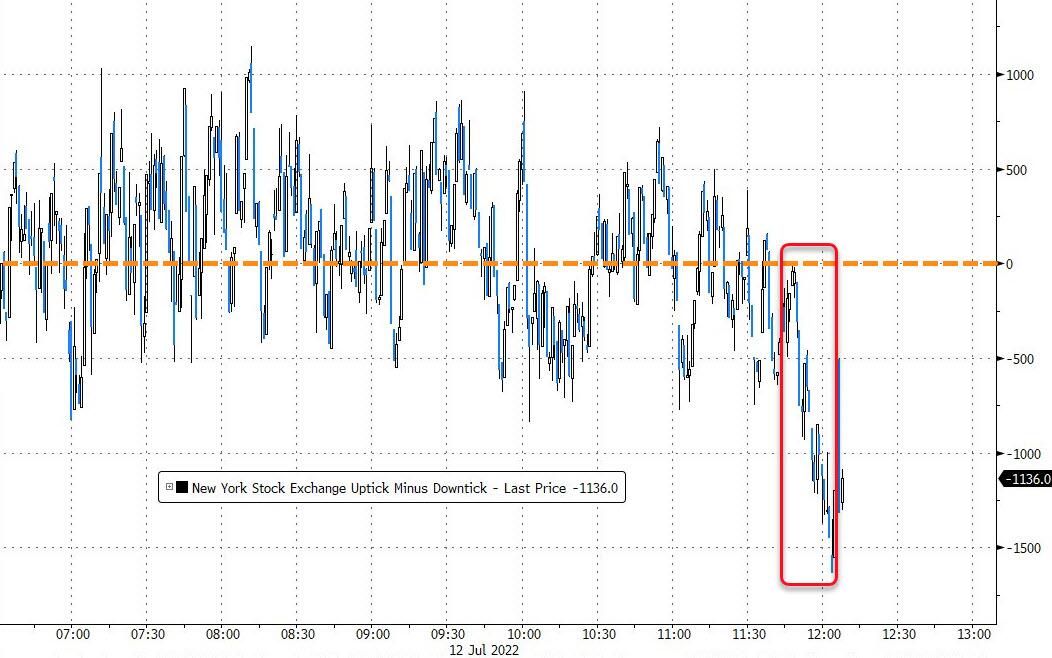
Bond yields dumped and pumped, but the 10-year remained below its 3% level. The biggest sell program in 2 weeks kicked in today, and those already were among the biggest in history.
The loser of the day was Crude Oil, which tumbled over 8% to close at under $96.
All eyes are on tomorrow’s CPI report, which has exceeded expectations for the past 5 months, with the S&P 500 having fallen by an average of -0.78% on CPI-day, as ZH reported.
Will tomorrow be different?
2. ETFs in the Spotlight
In case you missed the announcement and description of this section, you can read it here again.
It features some of the 10 broadly diversified domestic and sector ETFs from my HighVolume list as posted every Saturday. Furthermore, they are screened for the lowest MaxDD% number meaning they have been showing better resistance to temporary sell offs than all others over the past year.
The below table simply demonstrates the magnitude with which these ETFs are fluctuating above or below their respective individual trend lines (%+/-M/A). A break below, represented by a negative number, shows weakness, while a break above, represented by a positive percentage, shows strength.
For hundreds of ETF choices, be sure to reference Thursday’s StatSheet.
For this closed-out domestic “Buy” cycle (2/24/2022), here’s how some of our candidates have fared:
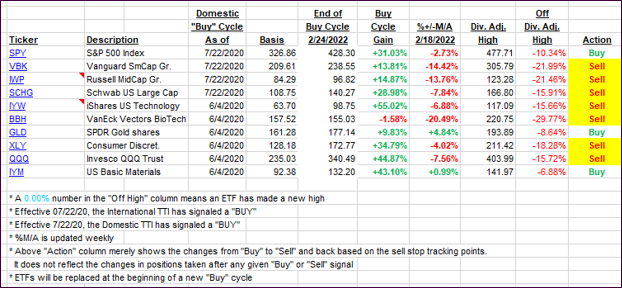
Click image to enlarge.
Again, the %+/-M/A column above shows the position of the various ETFs in relation to their respective long-term trend lines, while the trailing sell stops are being tracked in the “Off High” column. The “Action” column will signal a “Sell” once the -12% point has been taken out in the “Off High” column, which has replaced the prior -8% to -10% limits.
3. Trend Tracking Indexes (TTIs)
Our TTIs slipped as early bullish momentum vanished.
This is how we closed 07/12/2022:
Domestic TTI: -10.81% below its M/A (prior close -10.38%)—Sell signal effective 02/24/2022.
International TTI: -12.94% below its M/A (prior close -12.66%)—Sell signal effective 03/08/2022.
Disclosure: I am obliged to inform you that I, as well as my advisory clients, own some of the ETFs listed in the above table. Furthermore, they do not represent a specific investment recommendation for you, they merely show which ETFs from the universe I track are falling within the specified guidelines.
All linked charts above are courtesy of Bloomberg via ZeroHedge.
Contact Ulli