- Moving the markets
With uncertainty about the upcoming earnings season taking center stage, and traders having more questions than answers, the markets simply took the path of least resistance, which was down.
The major indexes never saw any green numbers and vacillated below their respective unchanged lines, as the Nasdaq fared the worst by dropping -2.26%.
We have now reached an economic environment where past earnings are taking a backseat to future guidance and expectations, as companies tried to wrestle with rising prices, slowing growth and inflationary pressures, with the Fed appearing to be more aggressive in its interest rate hiking plans as traders had hoped for.
Analyst Peter Tchir called the overall confusion this way:
- Recession risk is real versus the economy is doing okay and a soft landing is on the table.
- Recession risk is bad for risky assets versus recession risk keeps rates lower which is good for risky assets.
After having had time to digest Friday’s jobs report, ZeroHedge reported that the realization dawned that the labor market was in fact not as strong as talking heads had proclaimed.
The futures markets started things in the red and that negative sentiment set the tone for the entire session. Not helping matters was the absence of a short squeeze, which seemed to have run out of ammo.
Even a drop in bond yields across the board did not make a difference, despite the 10-year dipping below its 3% level again. The US dollar rallied, Crude Oil dropped, and Gold drifted lower.
A variety of critical data releases are on deck this week, with the most watched being the CPI and the PPI, either one of which can have market moving effects.
2. ETFs in the Spotlight
In case you missed the announcement and description of this section, you can read it here again.
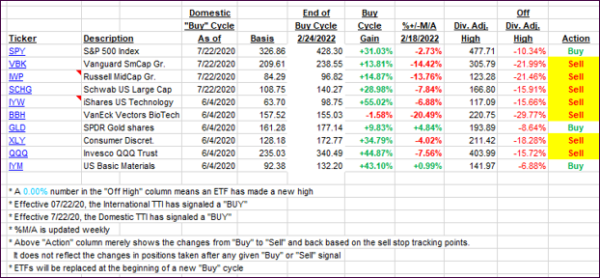
It features some of the 10 broadly diversified domestic and sector ETFs from my HighVolume list as posted every Saturday. Furthermore, they are screened for the lowest MaxDD% number meaning they have been showing better resistance to temporary sell offs than all others over the past year.
The below table simply demonstrates the magnitude with which these ETFs are fluctuating above or below their respective individual trend lines (%+/-M/A). A break below, represented by a negative number, shows weakness, while a break above, represented by a positive percentage, shows strength.
For hundreds of ETF choices, be sure to reference Thursday’s StatSheet.
For this closed-out domestic “Buy” cycle (2/24/2022), here’s how some of our candidates have fared:

Click image to enlarge.
Again, the %+/-M/A column above shows the position of the various ETFs in relation to their respective long-term trend lines, while the trailing sell stops are being tracked in the “Off High” column. The “Action” column will signal a “Sell” once the -12% point has been taken out in the “Off High” column, which has replaced the prior -8% to -10% limits.
3. Trend Tracking Indexes (TTIs)
Our TTIs dropped again as the bears ruled market direction.
This is how we closed 07/11/2022:
Domestic TTI: -10.38% below its M/A (prior close -9.54%)—Sell signal effective 02/24/2022.
International TTI: -12.66% below its M/A (prior close -11.60%)—Sell signal effective 03/08/2022.
Disclosure: I am obliged to inform you that I, as well as my advisory clients, own some of the ETFs listed in the above table. Furthermore, they do not represent a specific investment recommendation for you, they merely show which ETFs from the universe I track are falling within the specified guidelines.
All linked charts above are courtesy of Bloomberg via ZeroHedge.
Contact Ulli