
- Moving the markets
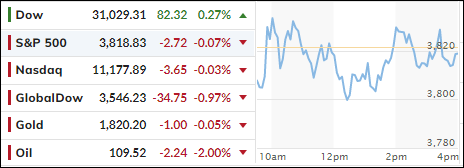
Despite an early pop in the major indexes, the struggle of finding a bottom, off which to launch a bullish rebound from, eluded traders and algos alike. Absent of a major Ramp-A-Thon tomorrow, the last day of the quarter, Wall Street will be left swallowing the bitter pill that the worst half of a year since 1970 has become reality.
Yesterday’s weak consumer sentiment drove another nail in the coffin of bullish hope, as a slowing economy and aggressive Fed rate hikes had occupied traders. Even the occasional “face-ripping” short-squeezes could not deny the fact that we are stuck in bear market territory, and that the fine art of catching a falling knife, AKA bottom fishing, may not be the wisest path of dealing with the current market environment.
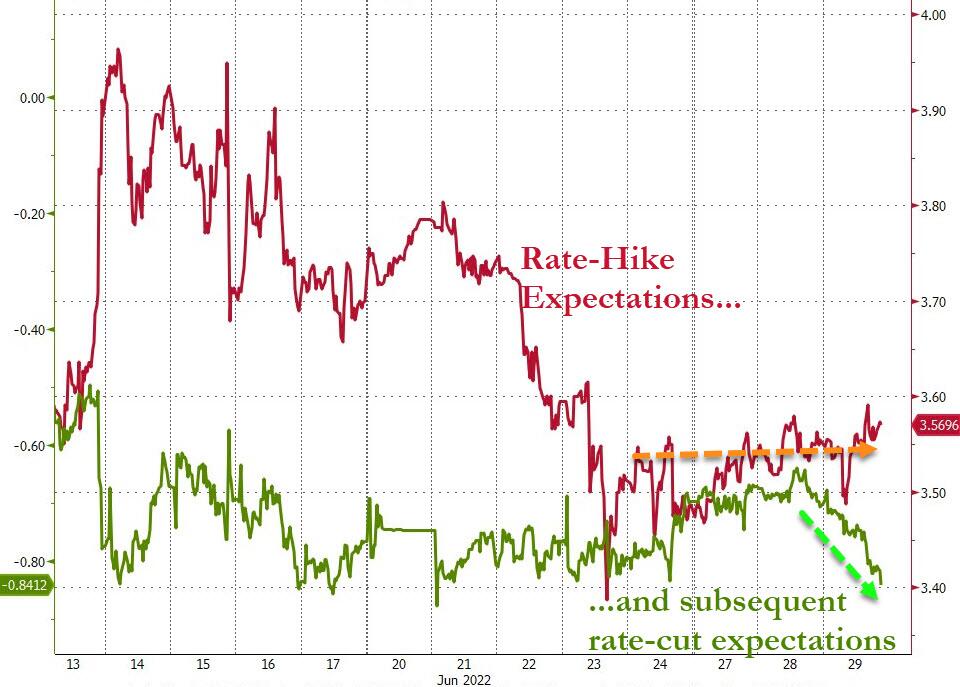
The end-result is, as ZeroHedge called it, that rate-hike expectations have stalled (i.e. the market no longer believes the Fed will be hiking as aggressively as it did) as recession fears are brought forward, and more notably subsequent rate-cut expectations have surged (now pricing in more than 3 rate-cuts).
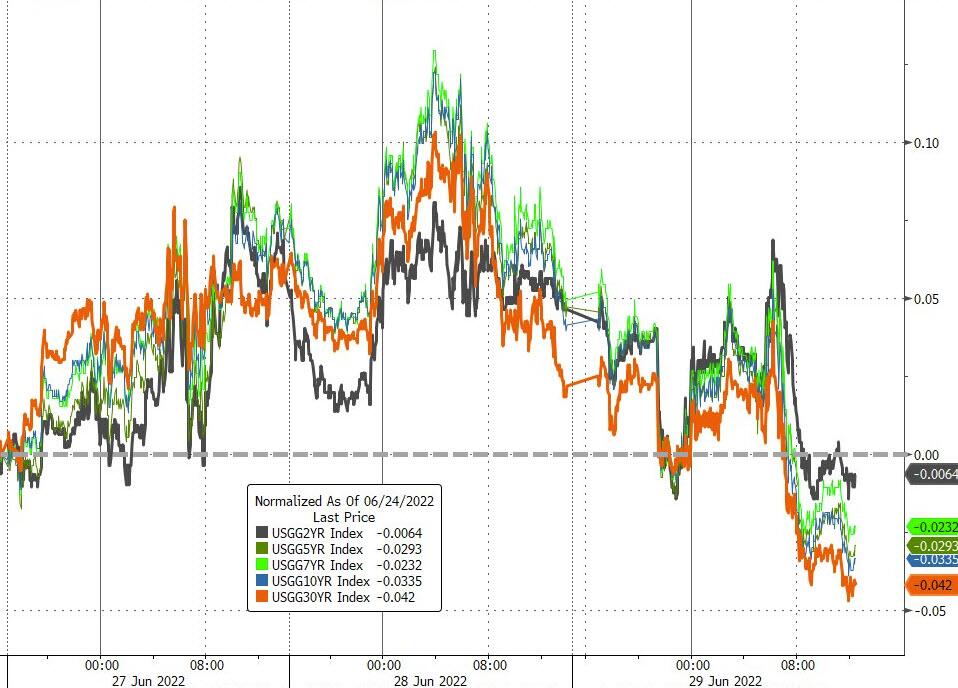
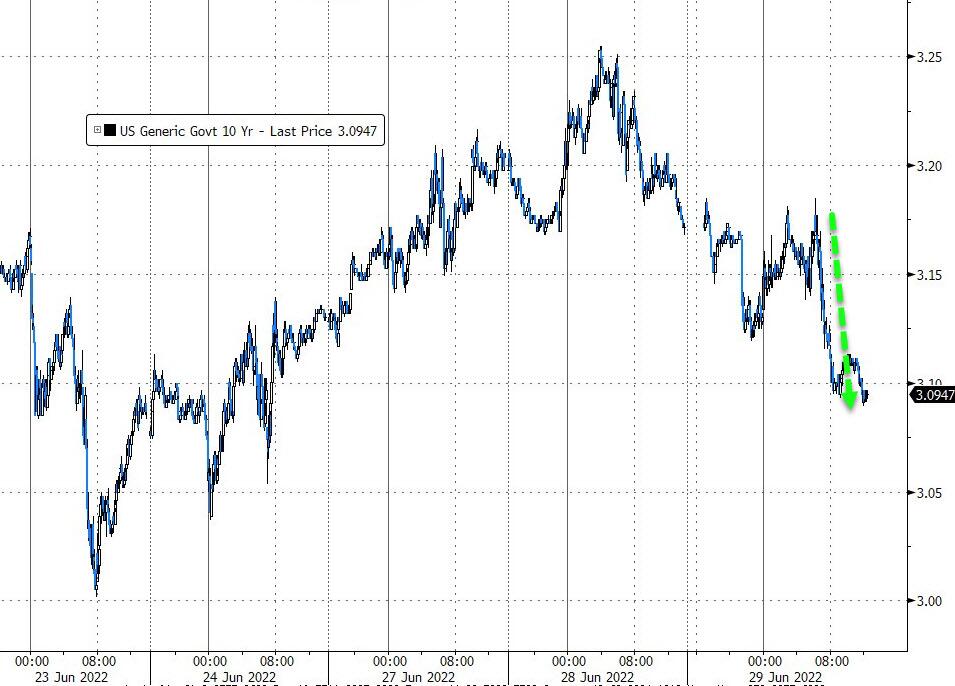
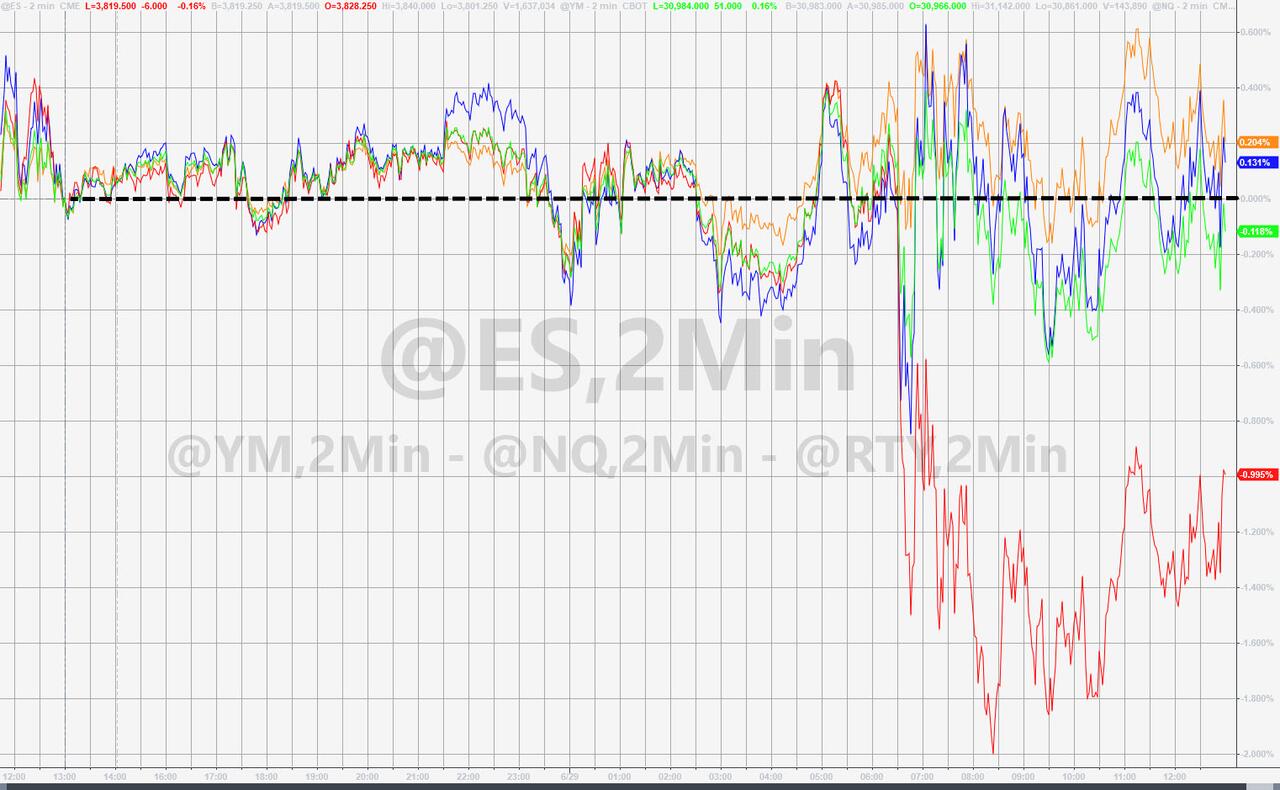
Bond prices rallied, as yields dropped with the 10-year sliding almost 8 bps to close at 3.10%, a substantial decline from yesterday’s high of 3.25%. The major indexes ended up hugging their unchanged lines, but SmallCaps were clobbered and lost around 1%.
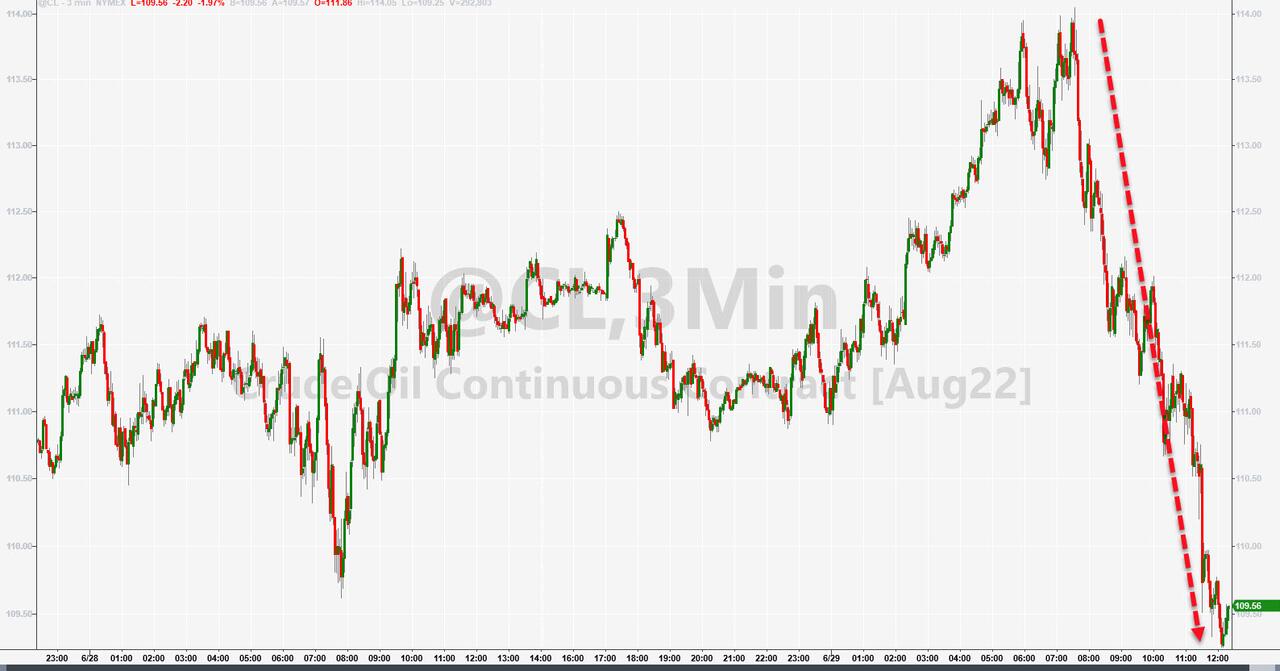
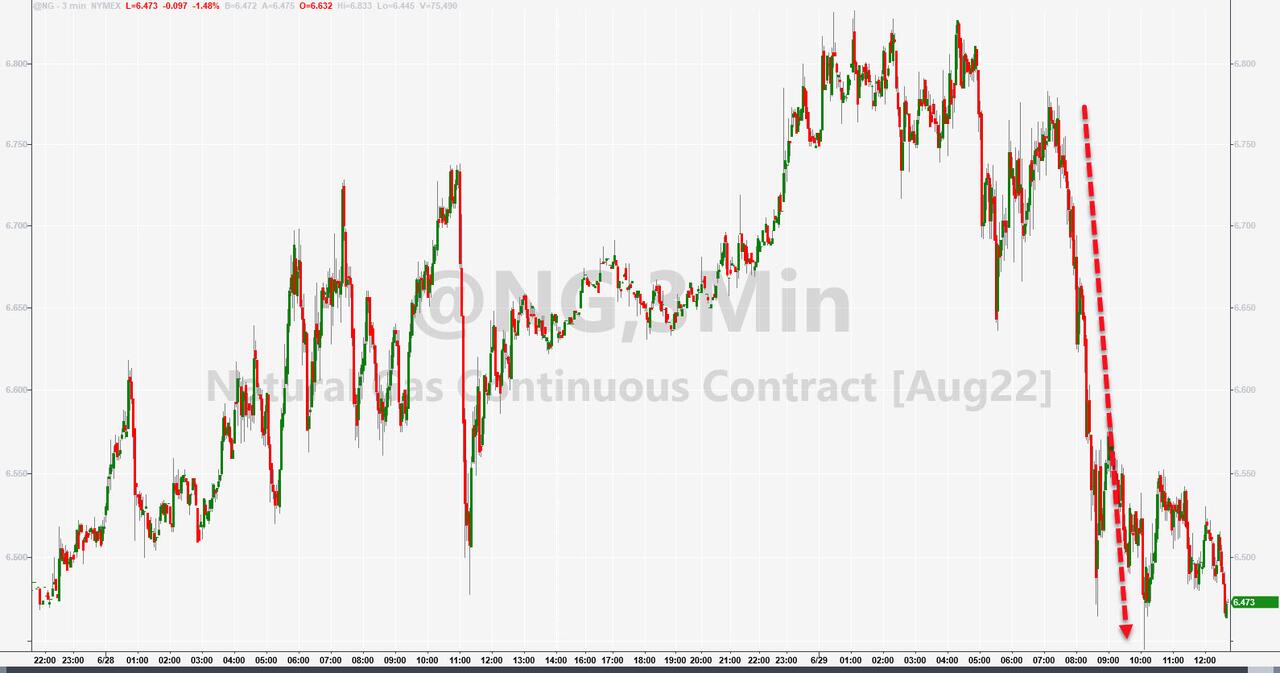
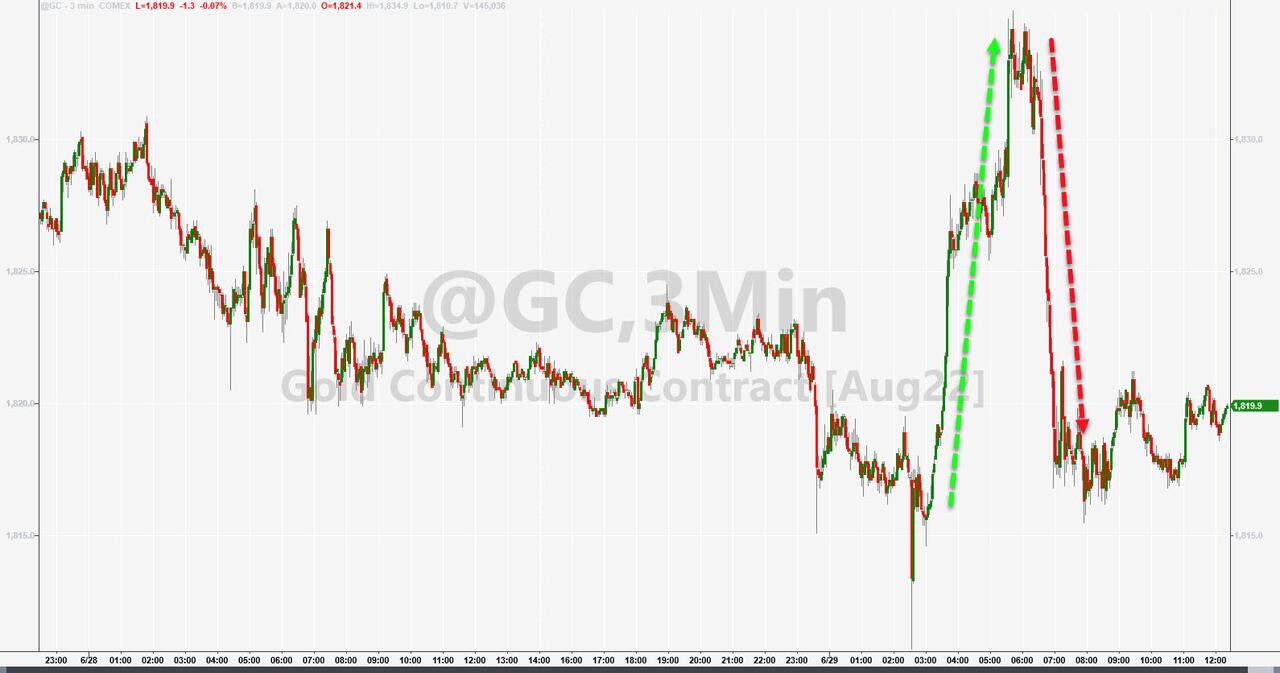
The US Dollar continued its bullish rampage, Crude Oil tanked on the day, as did Natural Gas, while Gold pumped and dumped and closed unchanged.
Treading water and going nowhere best describes this session driven by nothing but uncertainty.
2. ETFs in the Spotlight
In case you missed the announcement and description of this section, you can read it here again.
It features some of the 10 broadly diversified domestic and sector ETFs from my HighVolume list as posted every Saturday. Furthermore, they are screened for the lowest MaxDD% number meaning they have been showing better resistance to temporary sell offs than all others over the past year.
The below table simply demonstrates the magnitude with which these ETFs are fluctuating above or below their respective individual trend lines (%+/-M/A). A break below, represented by a negative number, shows weakness, while a break above, represented by a positive percentage, shows strength.
For hundreds of ETF choices, be sure to reference Thursday’s StatSheet.
For this closed-out domestic “Buy” cycle (2/24/2022), here’s how some of our candidates have fared:
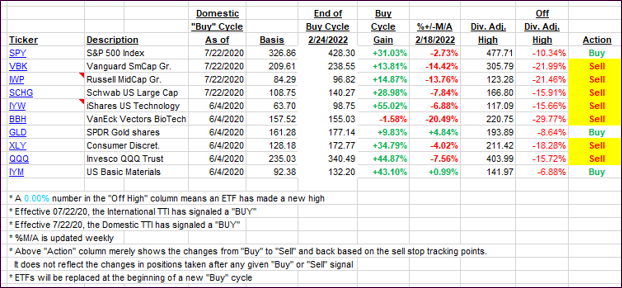
Click image to enlarge.
Again, the %+/-M/A column above shows the position of the various ETFs in relation to their respective long-term trend lines, while the trailing sell stops are being tracked in the “Off High” column. The “Action” column will signal a “Sell” once the -12% point has been taken out in the “Off High” column, which has replaced the prior -8% to -10% limits.
3. Trend Tracking Indexes (TTIs)
Our TTIs slipped again absent of any sustainable bullish momentum.
This is how we closed 06/29/2022:
Domestic TTI: -11.27% below its M/A (prior close -10.72%)—Sell signal effective 02/24/2022.
International TTI: -11.36% below its M/A (prior close -10.51%)—Sell signal effective 03/08/2022.
Disclosure: I am obliged to inform you that I, as well as my advisory clients, own some of the ETFs listed in the above table. Furthermore, they do not represent a specific investment recommendation for you, they merely show which ETFs from the universe I track are falling within the specified guidelines.
All linked charts above are courtesy of Bloomberg via ZeroHedge.
Contact Ulli