
- Moving the markets
Dip buyers and buy-and-holders suffered through another wild session not unlike the last quarter and the first half of 2022, during which the S&P 500 headed towards its worst result since 1970. But the latest update from Bloomberg shows that the index was down 21.01% in 1970 H1, but we are currently down 21.22% H1, so according to them this would be the worst since 1962… 60 years ago.
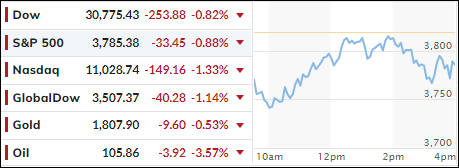
YTD, there was simply no place to hide with the Dow being down more than 15%, the S&P 500 having lost more than 20%, while the Nasdaq fared the worst by having surrendered almost 30%. And if you thought bonds were a safe place to be, you were sorely disappointed, as the widely held 20-year T-Bond ETF TLT was crushed over 23%.
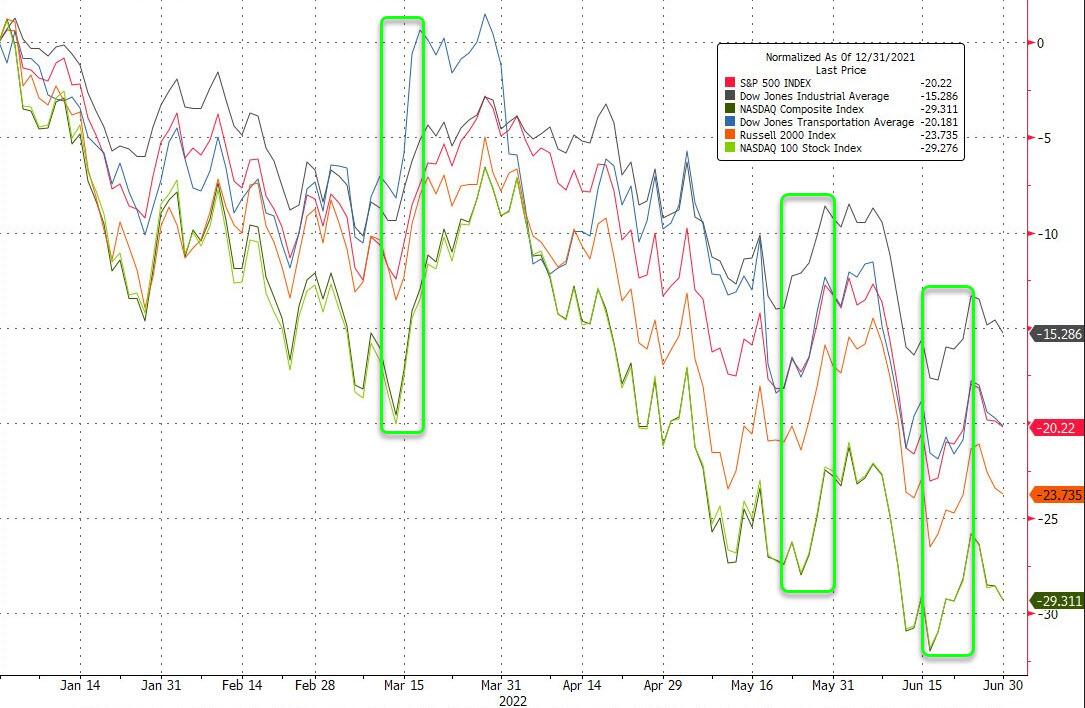
Buying the three major dips in 2022 proved to be nothing but an exercise in futility, as investors did not recognize that the market manipulation of the past decade had run its course and things are different now. The much-hoped for “Fed Put” seems to have vanished—at least for the time being.
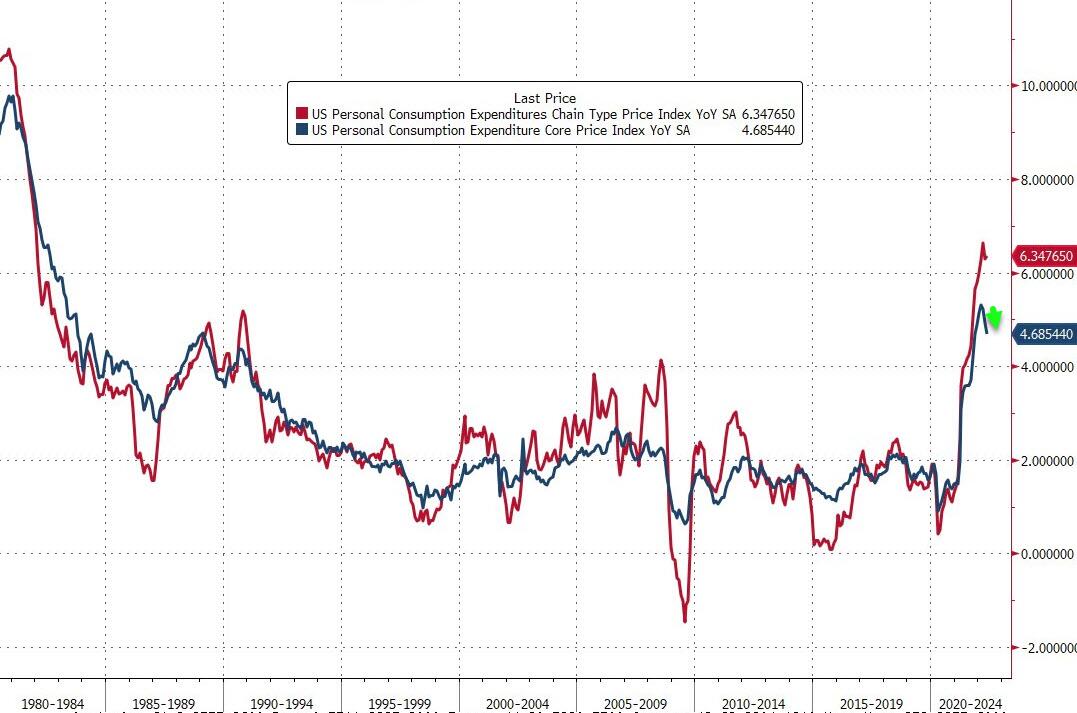
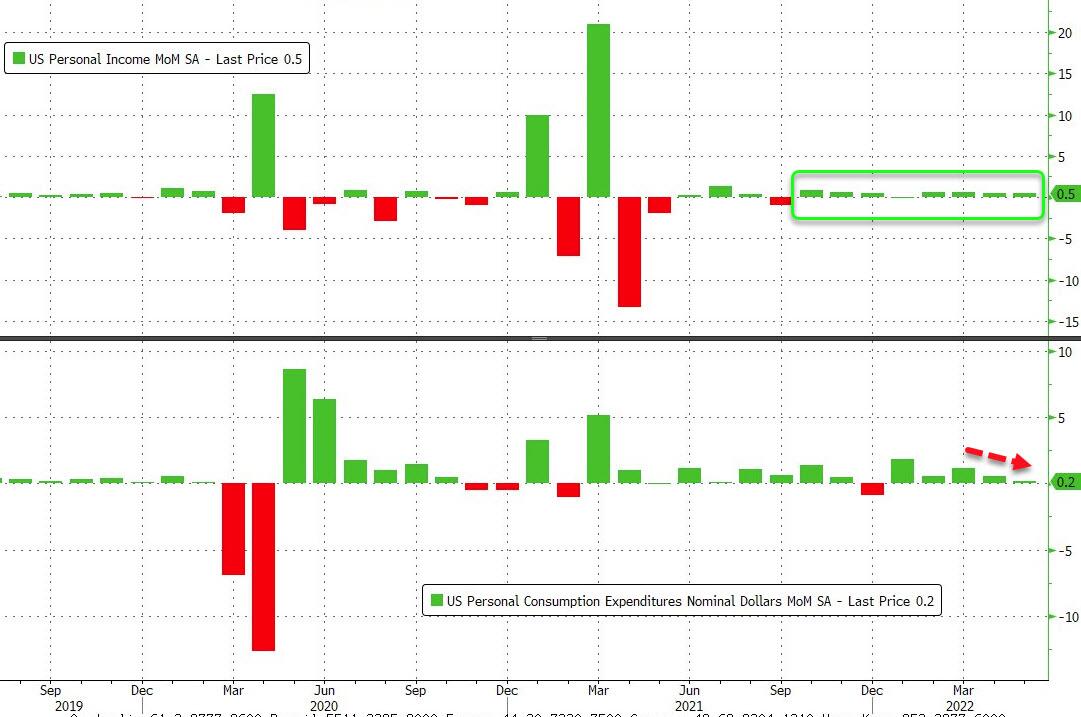
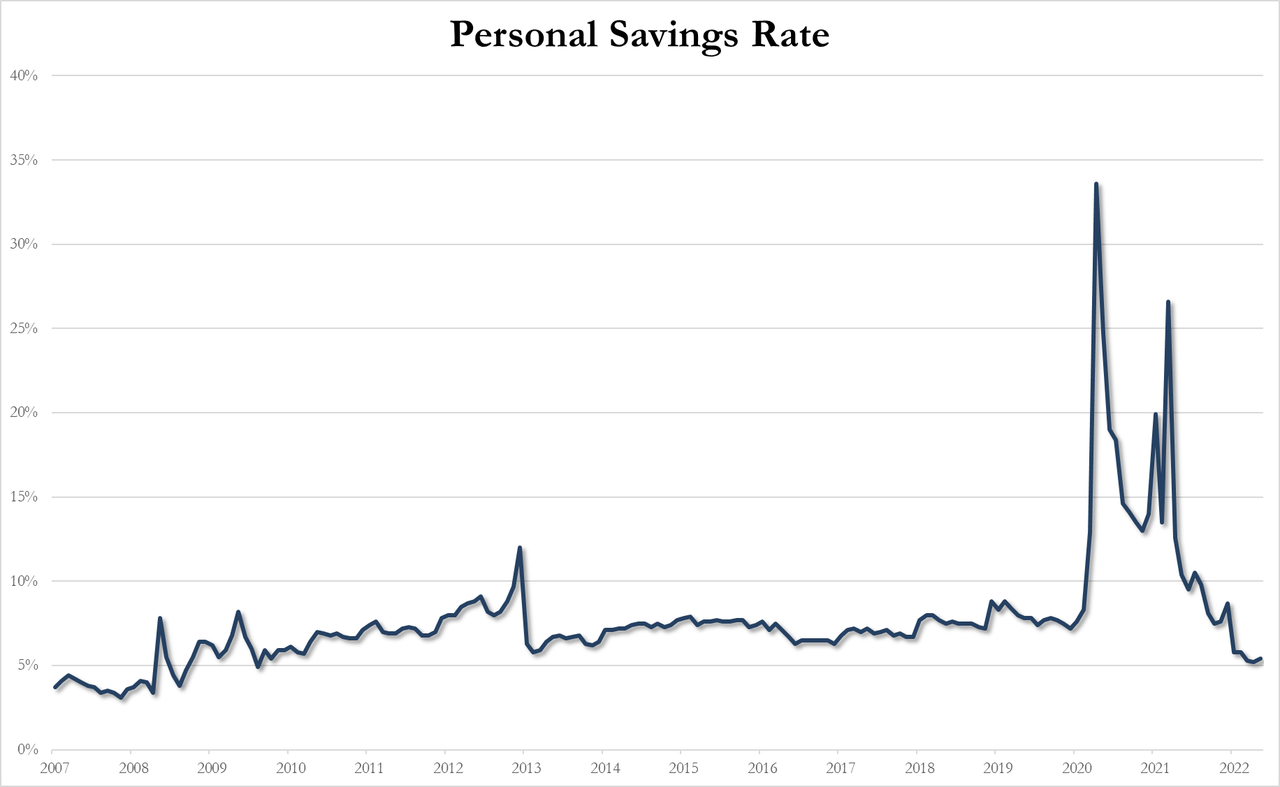
As ZeroHedge pointed out, despite the Fed’s favorite inflation indicator dipping, US consumer spending slowed down in May. On a YoY basis, incomes grew at 5.3% but spending rose at 5.8%, which is not exactly a solid trend that would bode well for the future of the economy. Adding insult to an already injured and squeezed consumer is the Personal Savings rate, which is heading in the wrong direction.
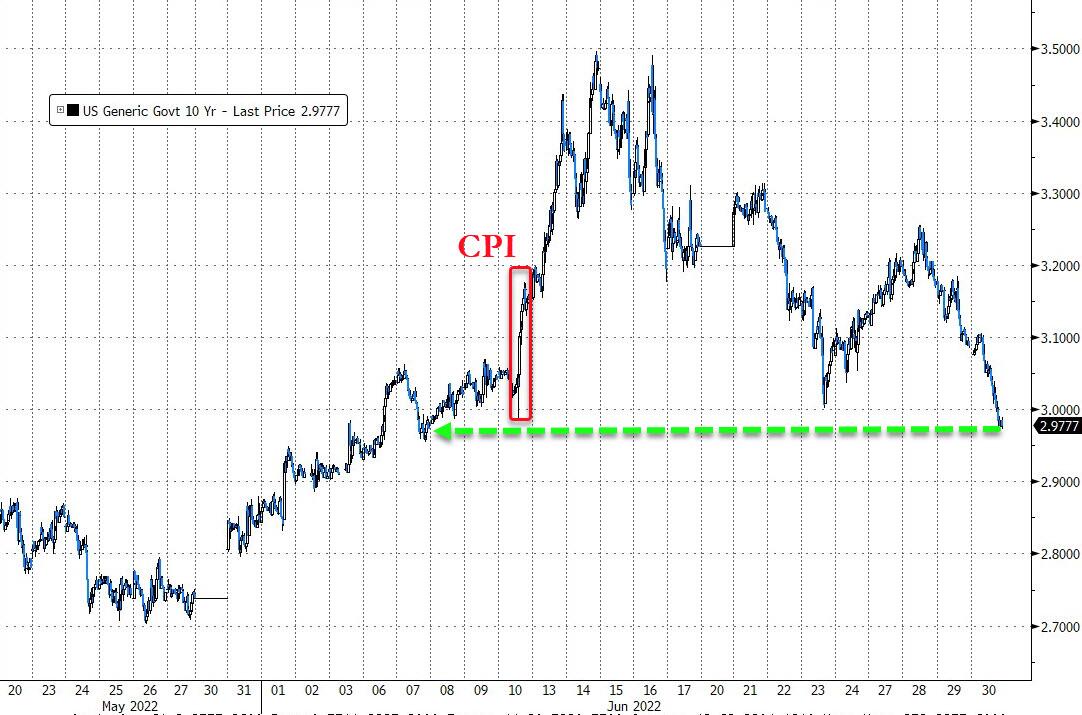
False hope about the economy was the keyword of the past quarter, as the Economic Surprise Index simply crashed and dashed expectations of a speedy recovery. This was clearly represented in the bond arena where yields rallied sharply during the first half of June, with the 10-year touching the 3.5% level, before concerns of a weakening economy pulled the yield back to the 3% level.
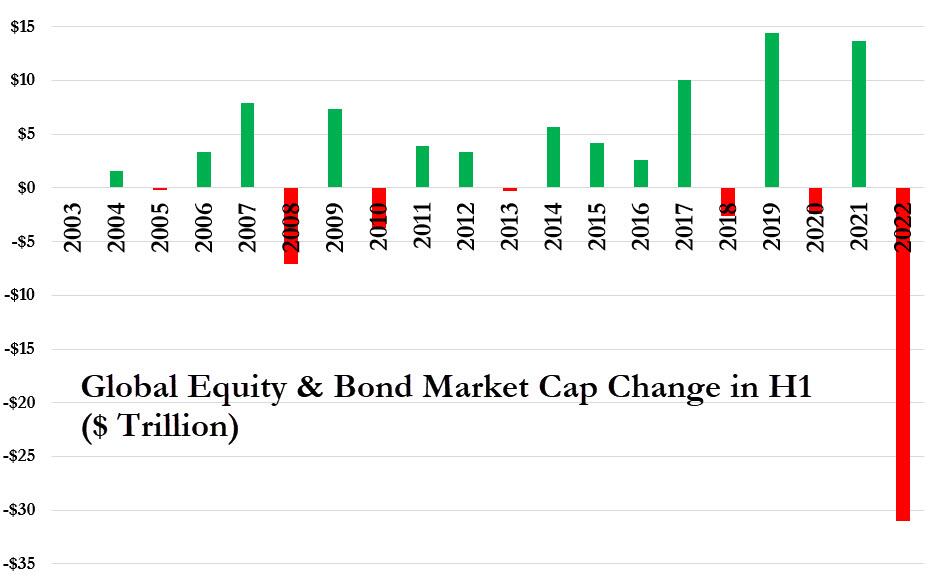
In the end, global equity and debt markets were pounded and lost a spectacular $31 trillion in value, as Bloomberg demonstrates in this chart. Confidence indicators across major economies are pointing towards a downturn. My Trend Tracing Indexes support that view, which means being out equities/bonds and sitting safely on the sidelines is the way to survive what’s coming.
On a personal note, I will be out tomorrow, so this will be the week-ending commentary with the StatSheet being posted later today.
I wish you a Happy 4th of July!
2. ETFs in the Spotlight
In case you missed the announcement and description of this section, you can read it here again.
It features some of the 10 broadly diversified domestic and sector ETFs from my HighVolume list as posted every Saturday. Furthermore, they are screened for the lowest MaxDD% number meaning they have been showing better resistance to temporary sell offs than all others over the past year.
The below table simply demonstrates the magnitude with which these ETFs are fluctuating above or below their respective individual trend lines (%+/-M/A). A break below, represented by a negative number, shows weakness, while a break above, represented by a positive percentage, shows strength.
For hundreds of ETF choices, be sure to reference Thursday’s StatSheet.
For this closed-out domestic “Buy” cycle (2/24/2022), here’s how some of our candidates have fared:
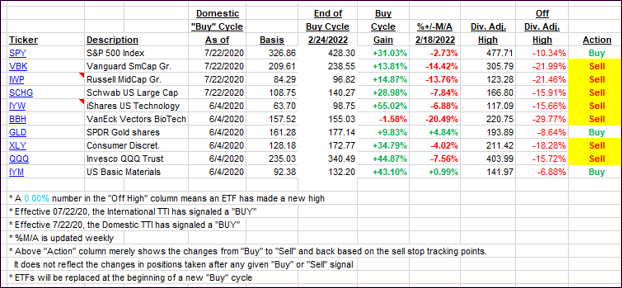
Click image to enlarge.
Again, the %+/-M/A column above shows the position of the various ETFs in relation to their respective long-term trend lines, while the trailing sell stops are being tracked in the “Off High” column. The “Action” column will signal a “Sell” once the -12% point has been taken out in the “Off High” column, which has replaced the prior -8% to -10% limits.
3. Trend Tracking Indexes (TTIs)
Our TTIs took another dive as a mid-day rebound attempt failed again.
This is how we closed 06/30/2022:
Domestic TTI: -11.82% below its M/A (prior close -11.27%)—Sell signal effective 02/24/2022.
International TTI: -12.33% below its M/A (prior close -11.36%)—Sell signal effective 03/08/2022.
Disclosure: I am obliged to inform you that I, as well as my advisory clients, own some of the ETFs listed in the above table. Furthermore, they do not represent a specific investment recommendation for you, they merely show which ETFs from the universe I track are falling within the specified guidelines.
All linked charts above are courtesy of Bloomberg via ZeroHedge.
Contact Ulli