
- Moving the markets
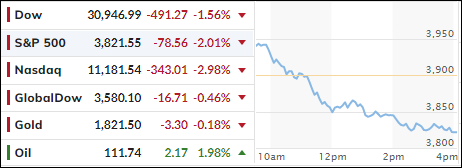
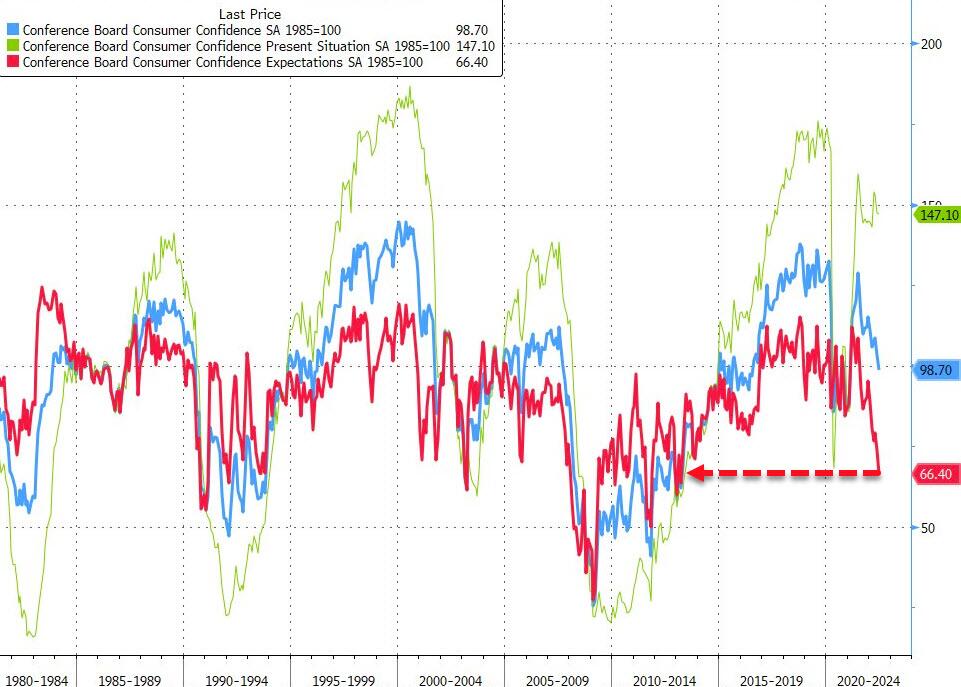
Despite an early bounce, the major indexes hit the skids due to disappointing economic data. The reversal started with the release of the Consumer Confidence Index, which crashed to a reading of 98.7 in June from a prior 103.2 vs. an expected 100.0.
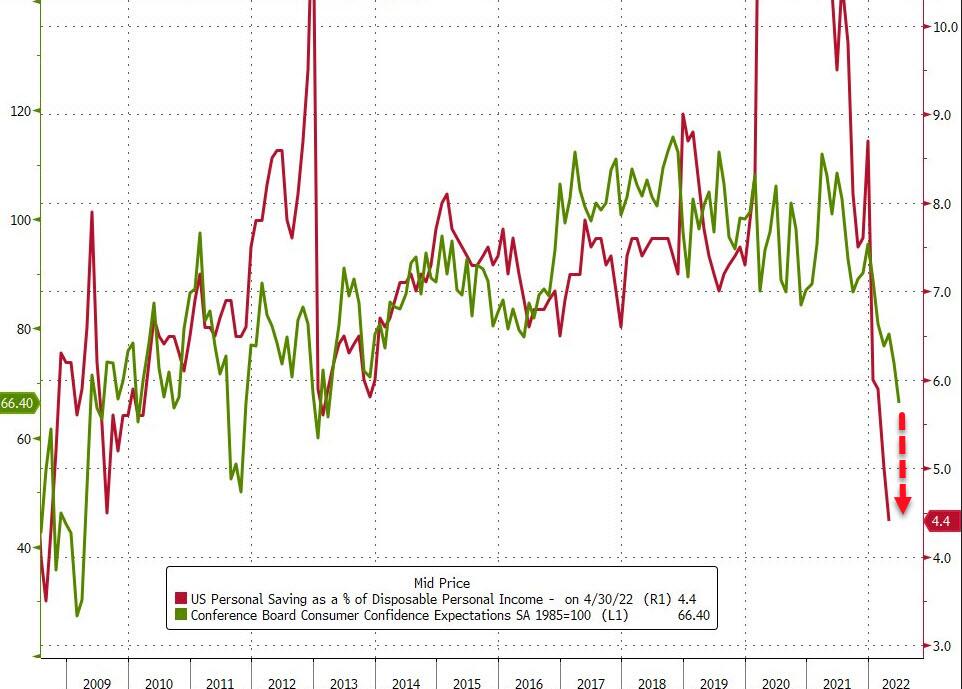
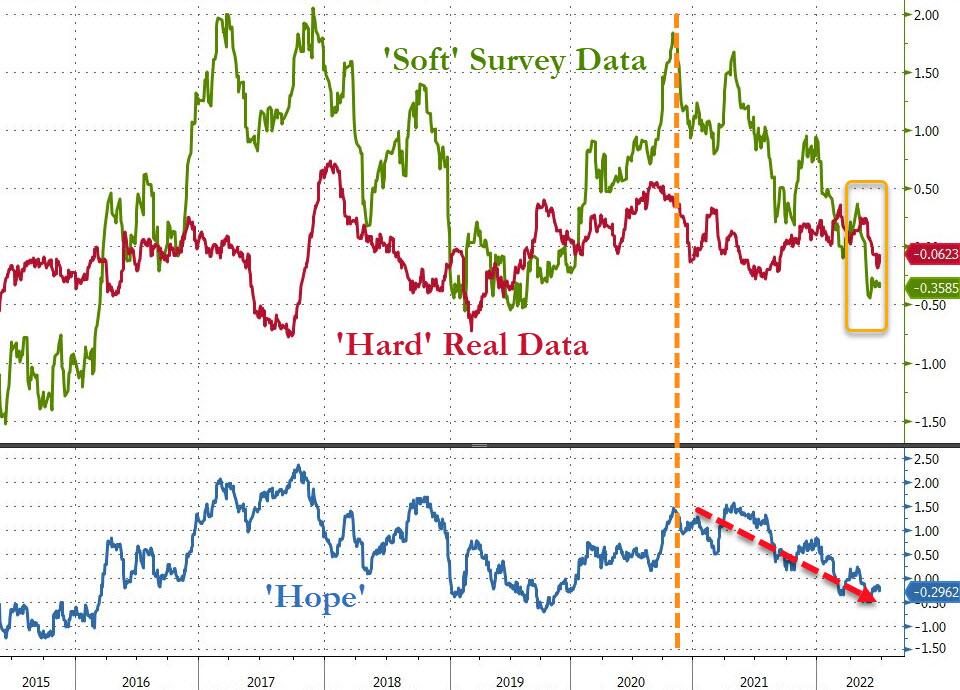
Additionally, as ZeroHedge reported, the actions of Americans, dumping their savings to afford the cost of living, suggests that Conference Board Expectations have further to fall. Finally, for the first time since 2019, “soft” survey data has dropped below “hard” real economic data, while “Hope” is getting hammered.
Ouch! None of this bodes well for our economic future, and especially for the prospect of increased earnings, and therefore stock prices, in an environment where 67% of economic growth is generated by consumers, which appear to be tapped out.
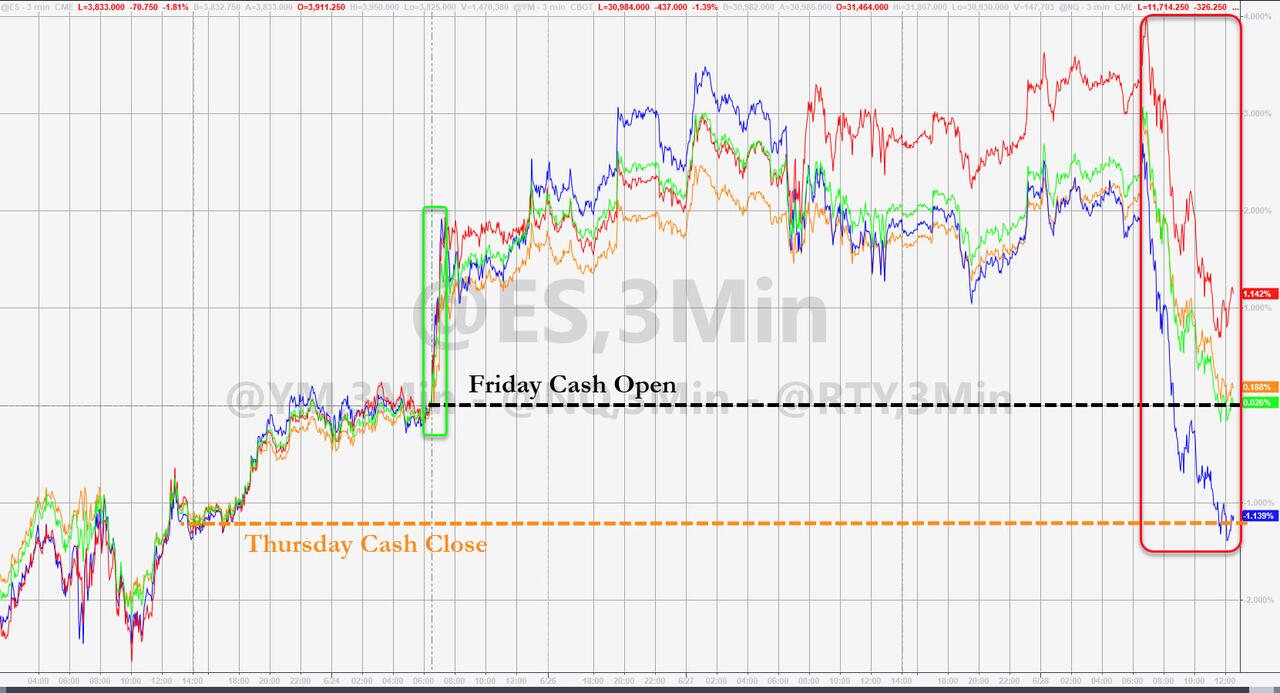
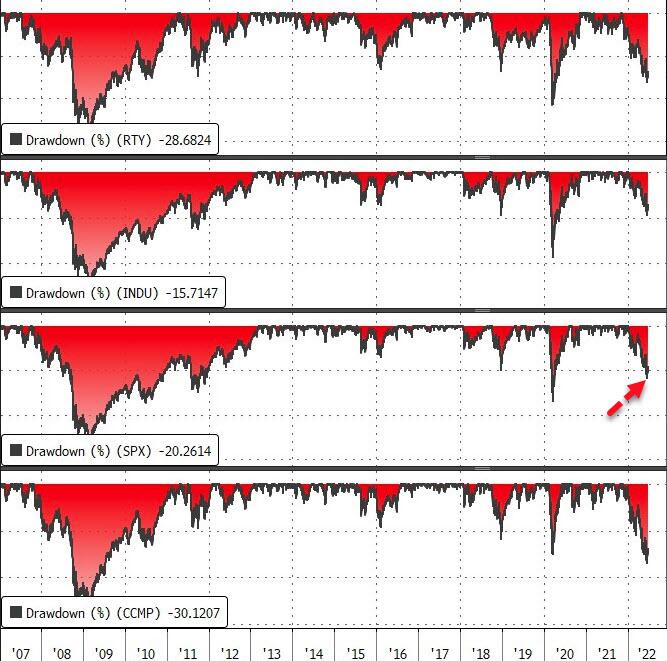
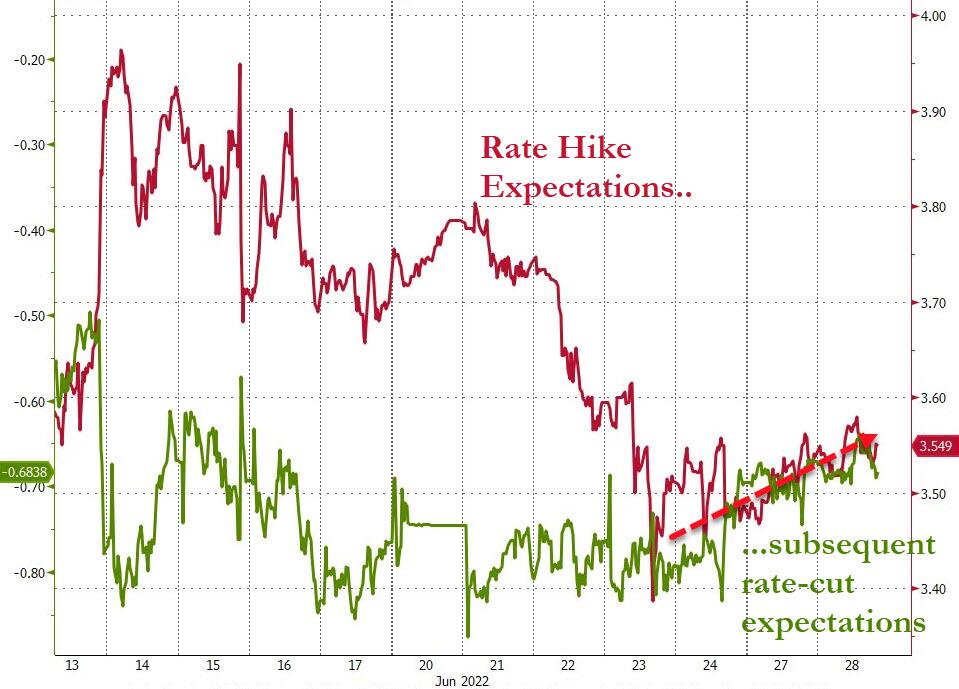
As a result, the major indexes got spanked with the S&P 500 dropping back into bear market territory, after just having climbed out of it last Friday. Hawkishness dominated the tone of the market, as rate hike expectations climbed again.
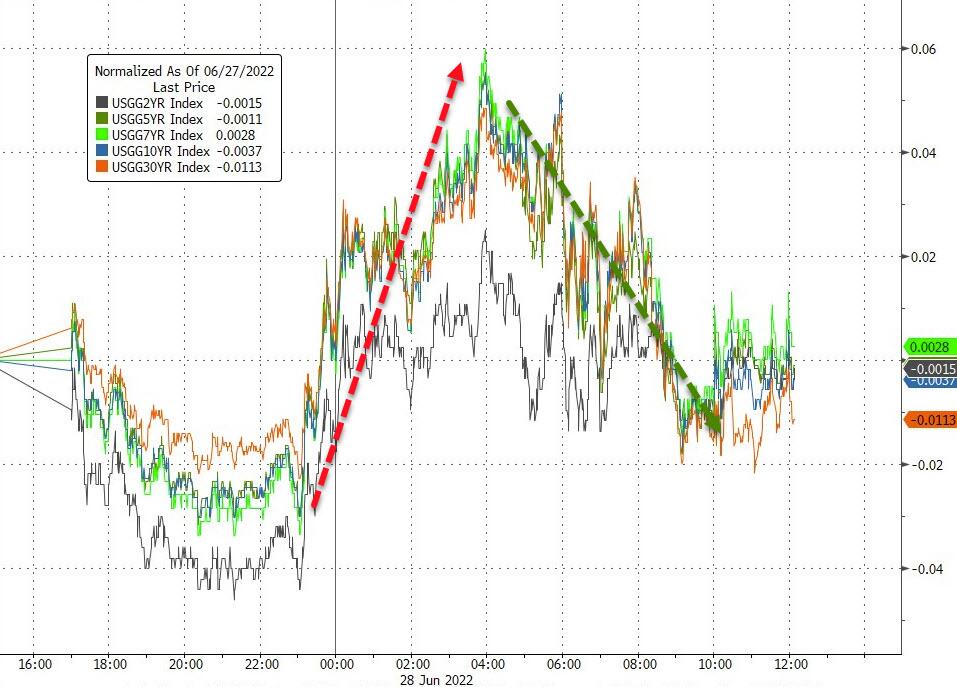
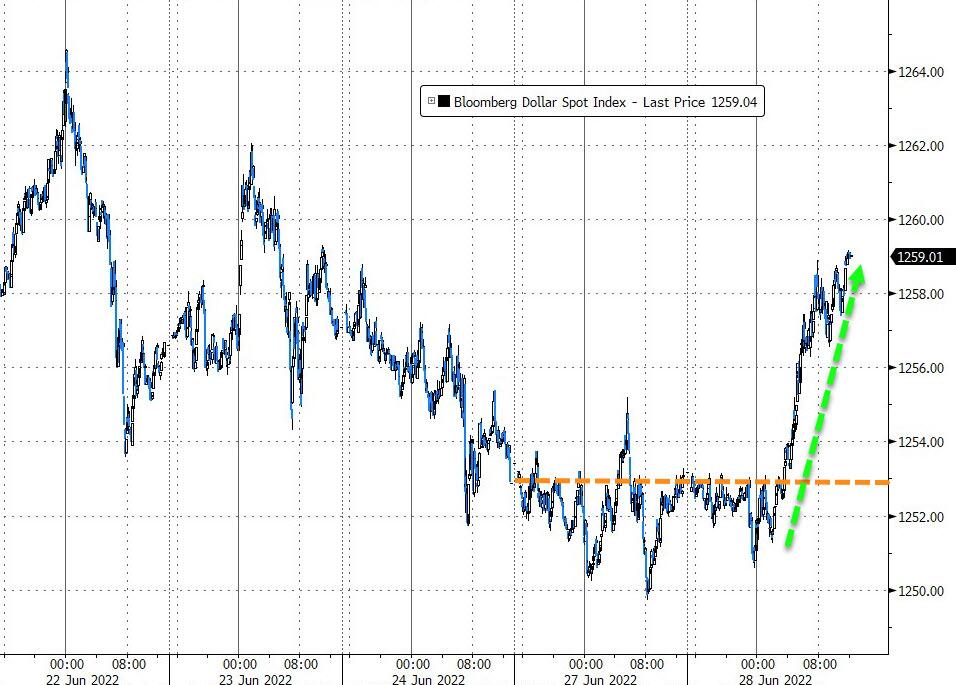
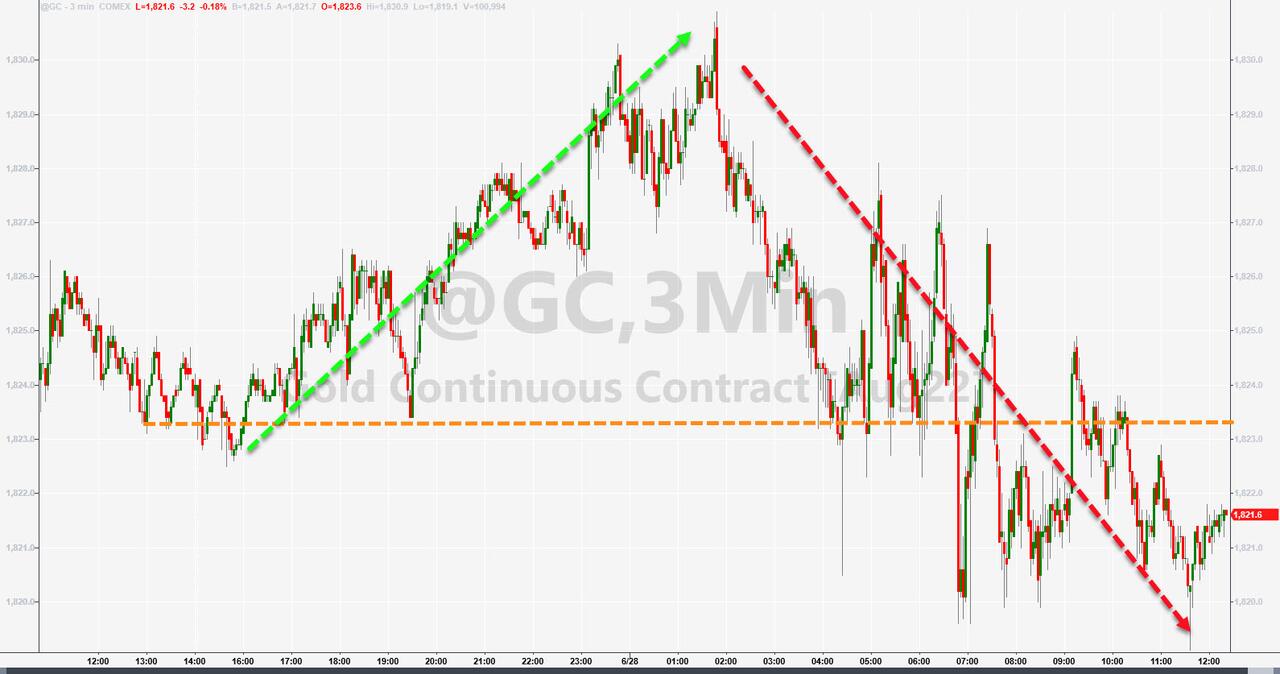
Bond yields ripped and dipped and ended the session just about unchanged, but the US Dollar recovered from its recent weakness and rallied. Gold had a great overnight session but was sold later with the precious metal dipping slightly into the red.
With two more trading days till the end of this horrific quarter, will the bulls be able to recoup some of their losses?
2. ETFs in the Spotlight
In case you missed the announcement and description of this section, you can read it here again.
It features some of the 10 broadly diversified domestic and sector ETFs from my HighVolume list as posted every Saturday. Furthermore, they are screened for the lowest MaxDD% number meaning they have been showing better resistance to temporary sell offs than all others over the past year.
The below table simply demonstrates the magnitude with which these ETFs are fluctuating above or below their respective individual trend lines (%+/-M/A). A break below, represented by a negative number, shows weakness, while a break above, represented by a positive percentage, shows strength.
For hundreds of ETF choices, be sure to reference Thursday’s StatSheet.
For this closed-out domestic “Buy” cycle (2/24/2022), here’s how some of our candidates have fared:
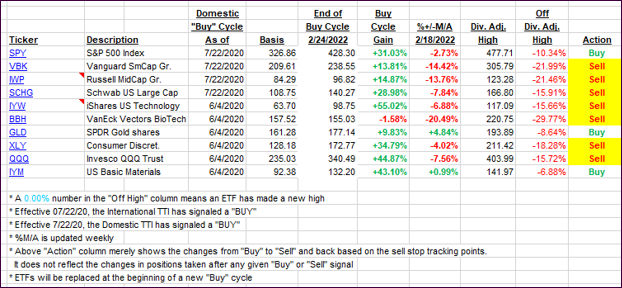
Click image to enlarge.
Again, the %+/-M/A column above shows the position of the various ETFs in relation to their respective long-term trend lines, while the trailing sell stops are being tracked in the “Off High” column. The “Action” column will signal a “Sell” once the -12% point has been taken out in the “Off High” column, which has replaced the prior -8% to -10% limits.
3. Trend Tracking Indexes (TTIs)
Our TTIs weakened, as the waning Consumer Confidence took a bit out of market optimism.
This is how we closed 06/28/2022:
Domestic TTI: -10.72% below its M/A (prior close -9.34%)—Sell signal effective 02/24/2022.
International TTI: -10.51% below its M/A (prior close -10.17%)—Sell signal effective 03/08/2022.
Disclosure: I am obliged to inform you that I, as well as my advisory clients, own some of the ETFs listed in the above table. Furthermore, they do not represent a specific investment recommendation for you, they merely show which ETFs from the universe I track are falling within the specified guidelines.
All linked charts above are courtesy of Bloomberg via ZeroHedge.
Contact Ulli