
- Moving the markets
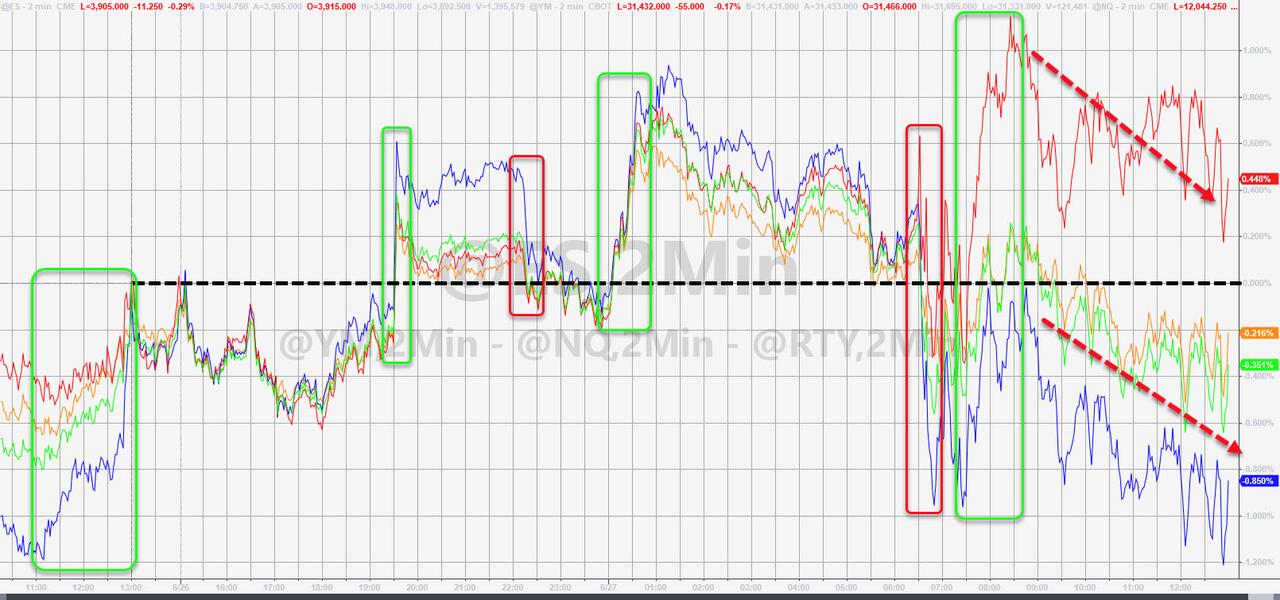
Traders continued their struggle of determining whether Friday’s comeback rally was truly indicative of stocks having found a bottom or just experienced another dead-cat-bounce. While I believe the latter is the case, we could see more upward momentum through the end of this quarter.
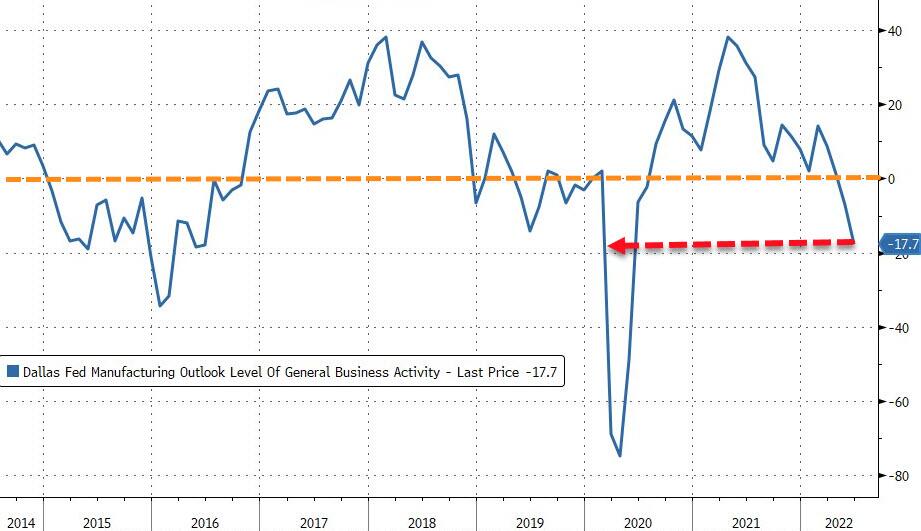
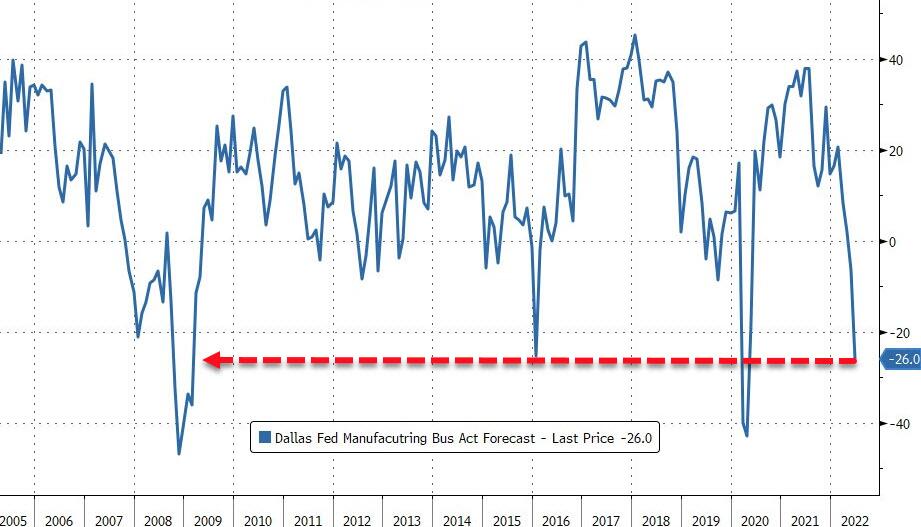
Today, markets were just aimlessly chopping around and digesting the various news items that simply added to intra-day volatility, of which we might see more during this week. Not helping matters was the plunge in the Dallas Fed index, which measures the Manufacturing business activity and the corresponding forecast, neither of which showed optimistic numbers.
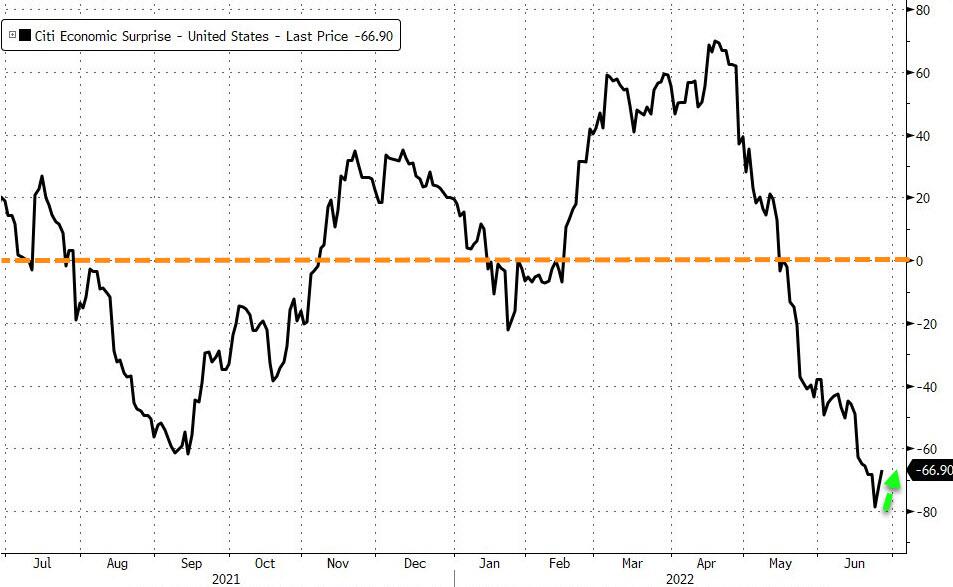
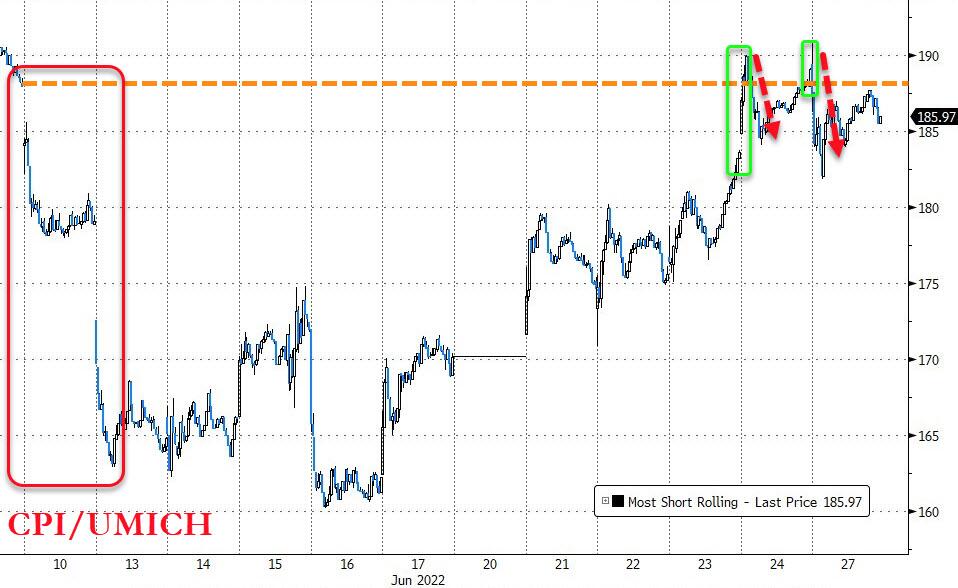
On the other hand, as ZeroHedge reported, the Economic Surprise Index showed some good news in that it ticked up slightly. That tiny little improvement was enough to send Rate Hike Expectations higher, as hawkish views were suddenly dominant again.
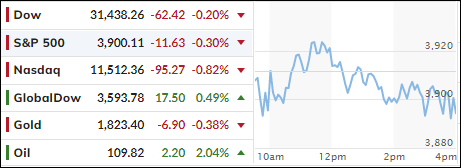
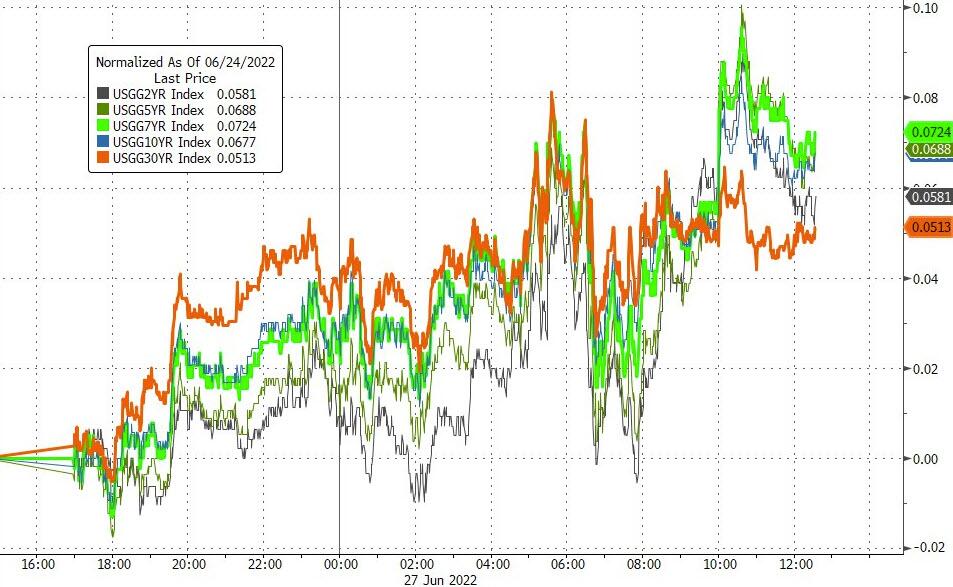
In the end, the major indexes lost some of Friday’s mojo and closed lower, while last week’s short squeeze ran out of ammo. Bond yields reversed as well and headed higher with the 10-year adding 7.6 bps to close at 3.21%.
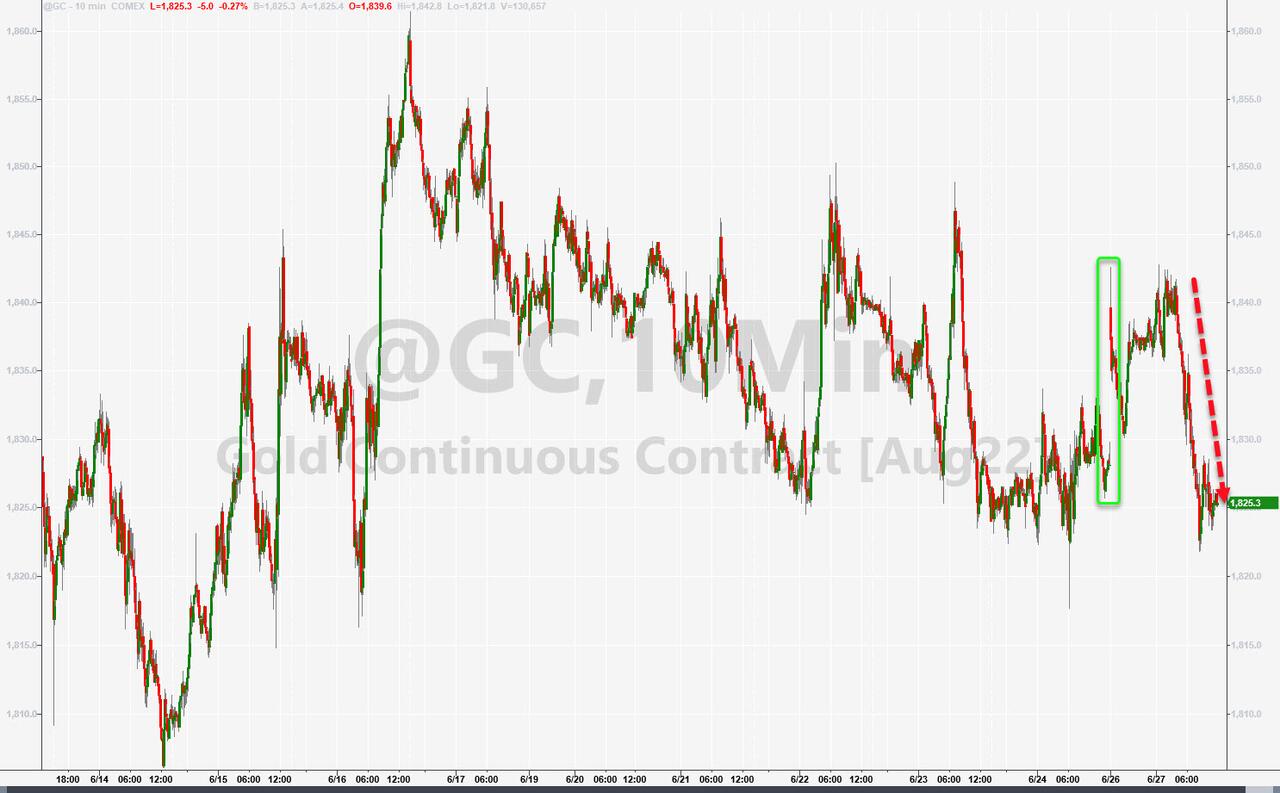
The US Dollar ended the session unchanged, while Gold popped and dropped and closed a tad lower.
Nothing was gained and not much was lost during these few hours of meaningless meandering.
2. ETFs in the Spotlight
In case you missed the announcement and description of this section, you can read it here again.
It features some of the 10 broadly diversified domestic and sector ETFs from my HighVolume list as posted every Saturday. Furthermore, they are screened for the lowest MaxDD% number meaning they have been showing better resistance to temporary sell offs than all others over the past year.
The below table simply demonstrates the magnitude with which these ETFs are fluctuating above or below their respective individual trend lines (%+/-M/A). A break below, represented by a negative number, shows weakness, while a break above, represented by a positive percentage, shows strength.
For hundreds of ETF choices, be sure to reference Thursday’s StatSheet.
For this closed-out domestic “Buy” cycle (2/24/2022), here’s how some of our candidates have fared:

Click image to enlarge.
Again, the %+/-M/A column above shows the position of the various ETFs in relation to their respective long-term trend lines, while the trailing sell stops are being tracked in the “Off High” column. The “Action” column will signal a “Sell” once the -12% point has been taken out in the “Off High” column, which has replaced the prior -8% to -10% limits.
3. Trend Tracking Indexes (TTIs)
Our TTIs barely changed with the major indexes treading water.
This is how we closed 06/27/2022:
Domestic TTI: -9.34% below its M/A (prior close -9.30%)—Sell signal effective 02/24/2022.
International TTI: -10.17% below its M/A (prior close -10.61%)—Sell signal effective 03/08/2022.
Disclosure: I am obliged to inform you that I, as well as my advisory clients, own some of the ETFs listed in the above table. Furthermore, they do not represent a specific investment recommendation for you, they merely show which ETFs from the universe I track are falling within the specified guidelines.
All linked charts above are courtesy of Bloomberg via ZeroHedge.
Contact Ulli