
- Moving the markets
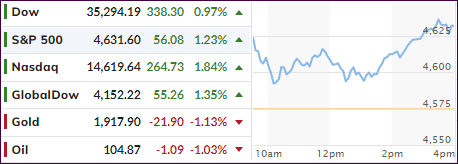
The winning steak continued and was supported by increased hopes that a Russian-Ukraine ceasefire may be on deck, despite the warring parties saying that they are not close to deal. Phrases like “nothing is agreed upon, unless everything is agreed upon,” took the starch out of the early bounce by mid-day, but the major indexes recovered and stormed into the close.
Financial and economic news were anything but encouraging but traders ignored the facts and stuck to their conviction that this impressive March bounce will continue and not be of limited duration.
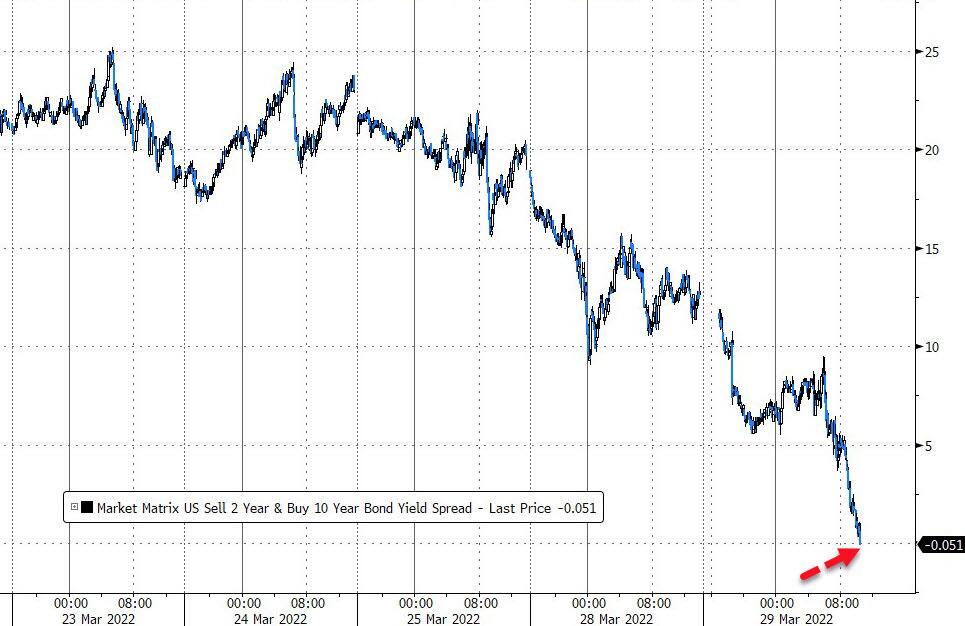
As ZeroHedge reported, one of the most widely followed yield curves (2s10s) inverted today, which means the 2-year bond yields more than the 10-year one, an anomaly that has in the past signaled a countdown to a recession.
As Deutsche Bank’s Jim Reid notes this morning, there has never been such a directional divergence possibly because the Fed has never been as behind the curve as they are today.
For a sense of just how far behind, The Taylor Rule suggests given the current inflation rate and unemployment rate, The Fed needs to hike by an absurd sounding 1155bps (11.55%) to get back to ‘normal’…
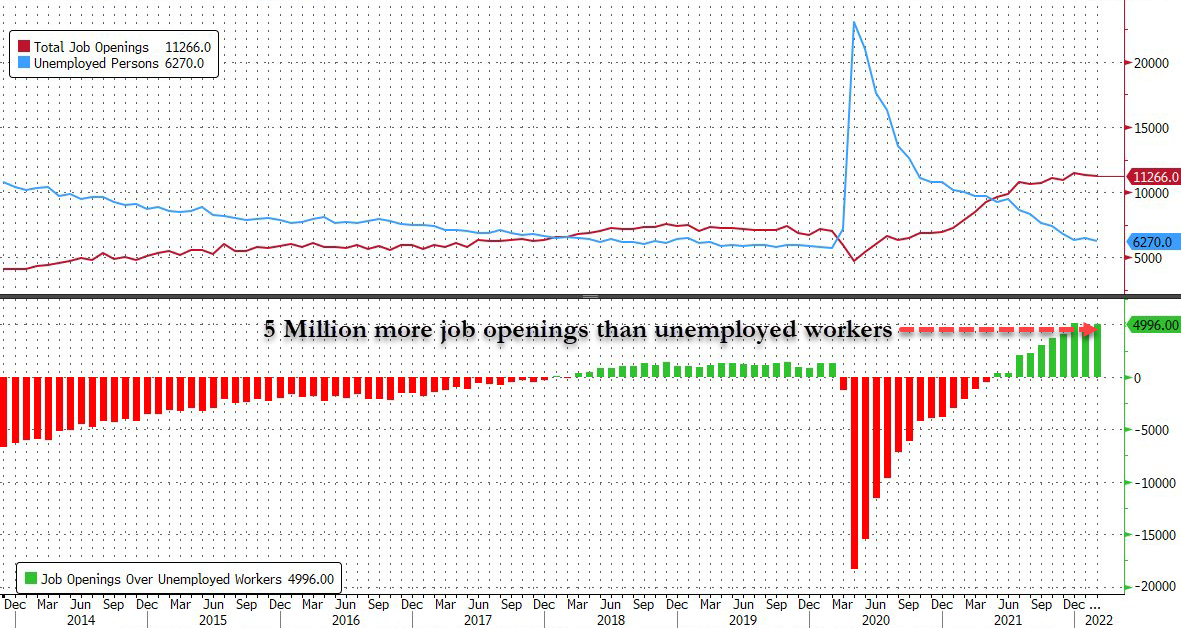
On the economic side, ZH pointed out that Job Openings are stubbornly stuck at an all-time high with 5 million more than unemployed workers.
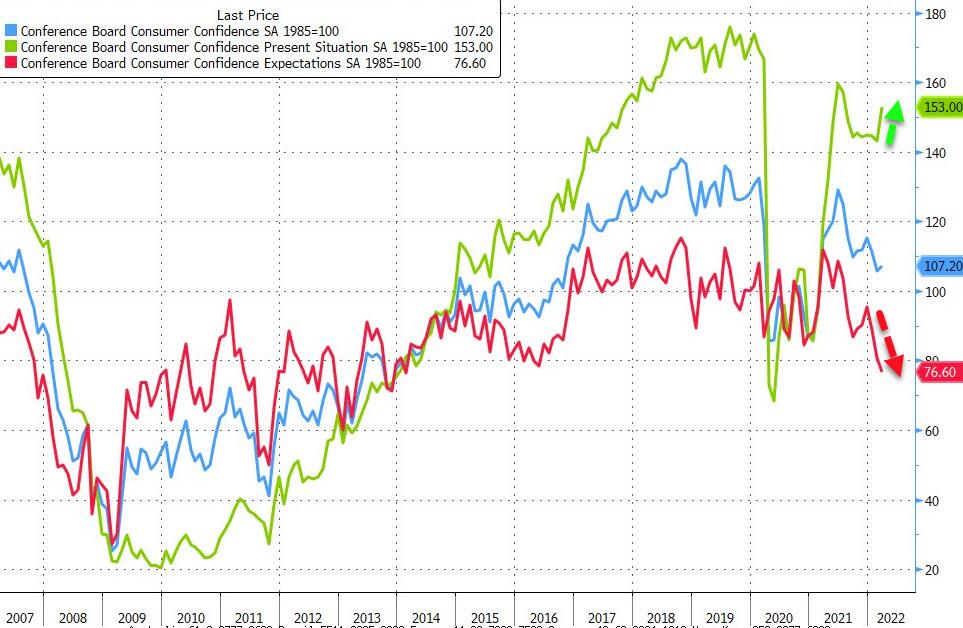
Then we learned that Inflation Expectations had hit record highs as ‘Hope’ crashed to 8-year lows, which is not exactly giving the economy a thumbs up.
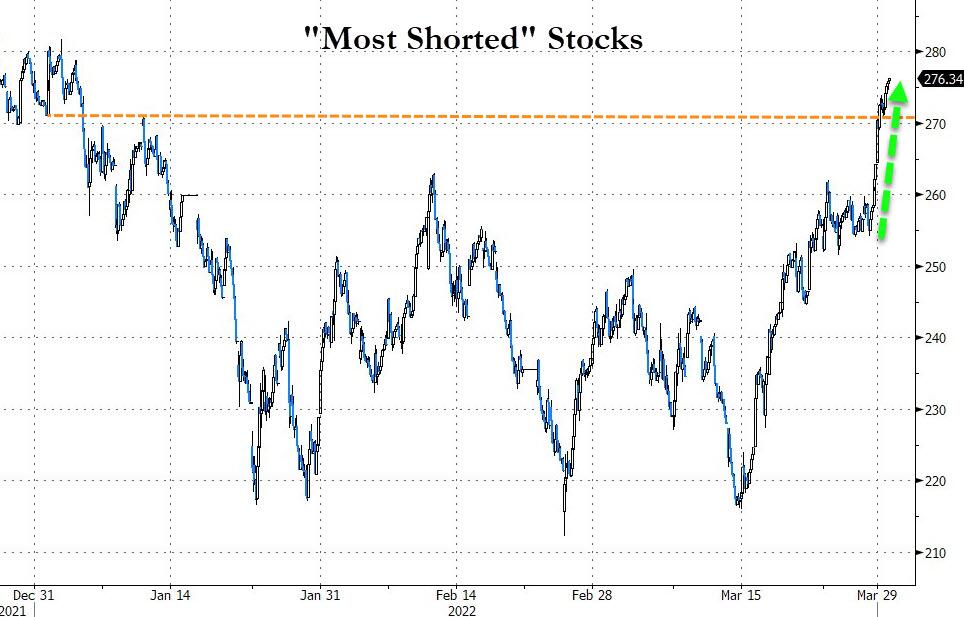
But, none of that mattered, as the usual short-squeeze was activated and helped the bulls to regain the upward momentum, which was lost mid-day.
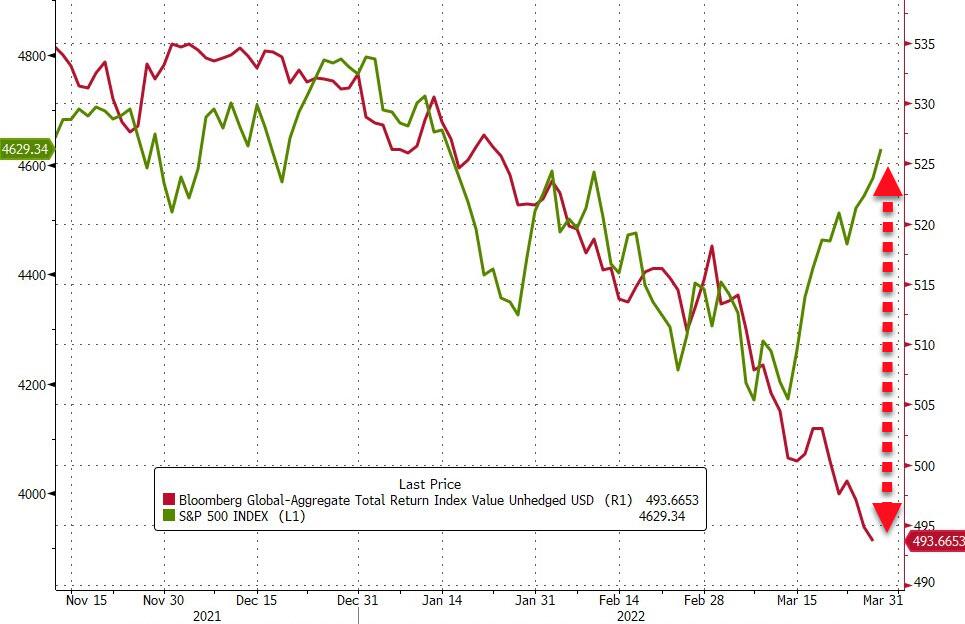
The divergence between bonds and stocks has been nothing short of spectacular during the past 10 days, as bonds got monkey hammered while stocks spiked. The spread between the two is now the 5th biggest since the 2008 meltdown.
How long can that last?
2. ETFs in the Spotlight
In case you missed the announcement and description of this section, you can read it here again.
It features some of the 10 broadly diversified domestic and sector ETFs from my HighVolume list as posted every Saturday. Furthermore, they are screened for the lowest MaxDD% number meaning they have been showing better resistance to temporary sell offs than all others over the past year.
The below table simply demonstrates the magnitude with which these ETFs are fluctuating above or below their respective individual trend lines (%+/-M/A). A break below, represented by a negative number, shows weakness, while a break above, represented by a positive percentage, shows strength.
For hundreds of ETF choices, be sure to reference Thursday’s StatSheet.
For this just closed-out domestic “Buy” cycle, here’s how some of our candidates have fared:
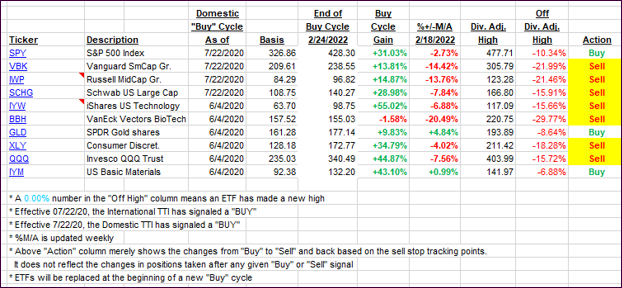
Click image to enlarge.
Again, the %+/-M/A column above shows the position of the various ETFs in relation to their respective long-term trend lines, while the trailing sell stops are being tracked in the “Off High” column. The “Action” column will signal a “Sell” once the -12% point has been taken out in the “Off High” column, which has replaced the prior -8% to -10% limits.
3. Trend Tracking Indexes (TTIs)
Our TTIs roared higher and have now reached a point that validates a new “BUY” signal in both areas. If you follow along on your own, use Thursday’s StatSheet to make ETF selections that best meet your risk tolerance.
The effective date will be tomorrow, unless there is a huge sell-off in the making, in which case I will hold off for another day.
Over the next few days, I will update the above Spotlight ETFs by making the appropriate changes.
This is how we closed 03/29/2022:
Domestic TTI: +4.20% above its M/A (prior close +2.50%)—Sell signal effective 02/24/2022.
International TTI: +2.20% above its M/A (prior close +0.88%)—Sell signal effective 03/08/2022.
Disclosure: I am obliged to inform you that I, as well as my advisory clients, own some of the ETFs listed in the above table. Furthermore, they do not represent a specific investment recommendation for you, they merely show which ETFs from the universe I track are falling within the specified guidelines.
All linked charts above are courtesy of Bloomberg via ZeroHedge.
Contact Ulli