
- Moving the markets
An early drop in the markets found a bottom and suddenly reversed after the Financial Times posted an article claiming this:
Russia is no longer requesting Ukraine be “denazified” and is prepared to let Kyiv join the European Union if it remains militarily non-aligned as part of ongoing ceasefire negotiations.
The draft ceasefire document does not contain any discussion of three of Russia’s initial core demands – “denazification”, “demilitarisation”, and legal protection for the Russian language in Ukraine.
Added ZH: And the market seems to be happy that the nazis can stay?
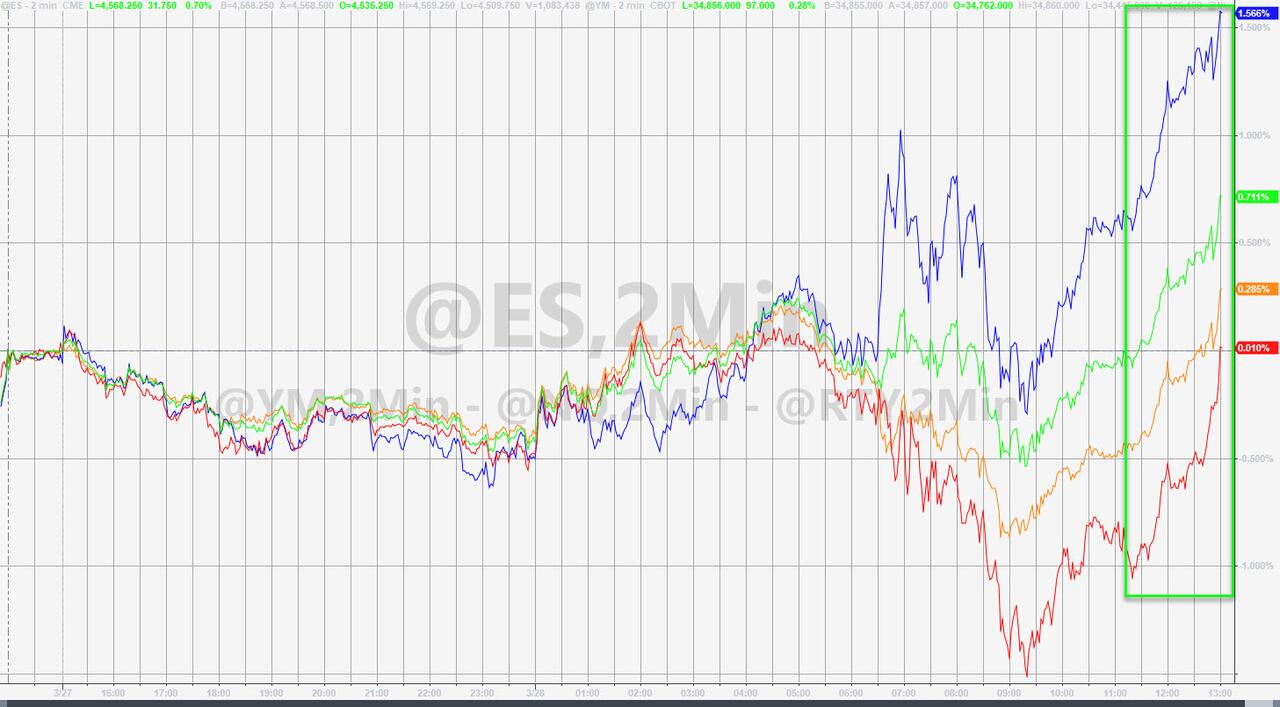
Whether this claim will hold up or not is immaterial, because the markets saw it as positive and the “digging out of a hole” process began with the major indexes closing in the green. The lead dog was the Nasdaq with +1.13%, as traders simply ignored recession fears, while the other two showed only modest gains.
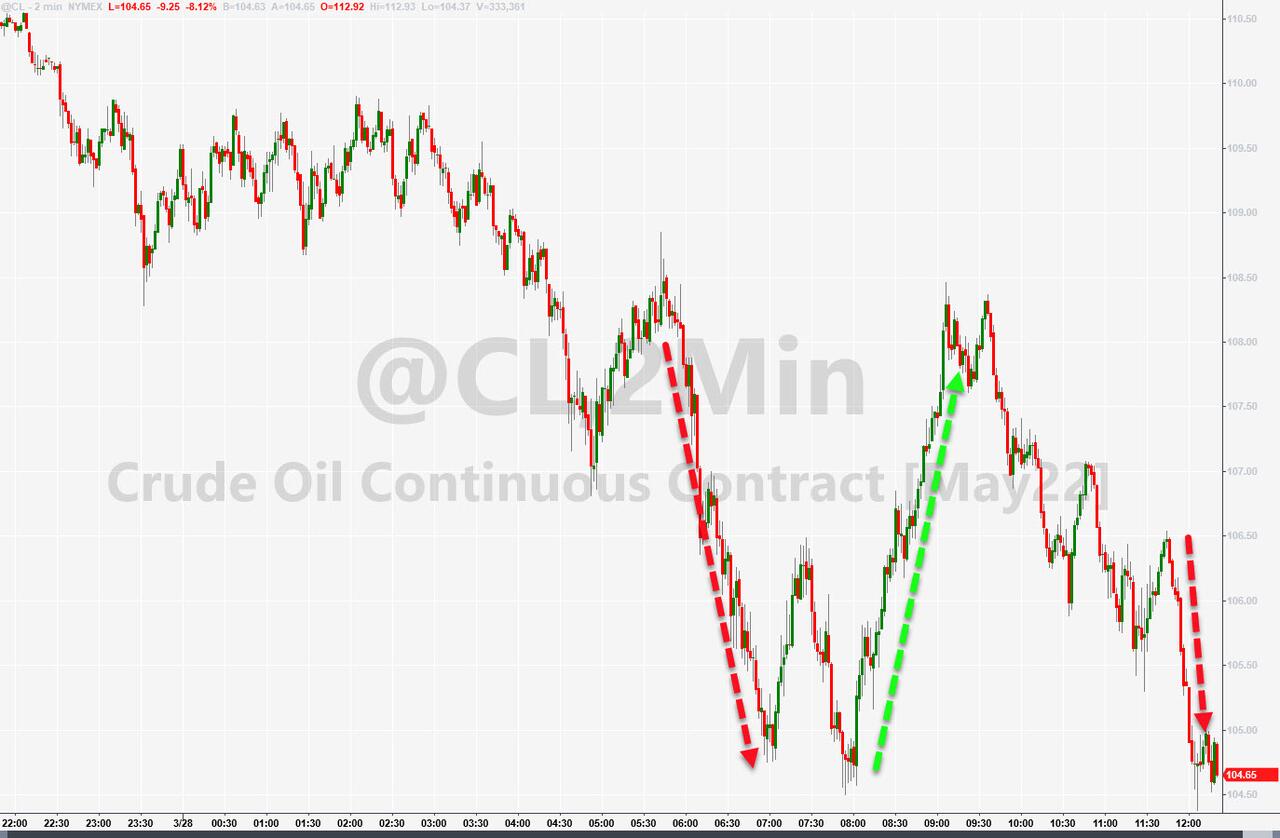
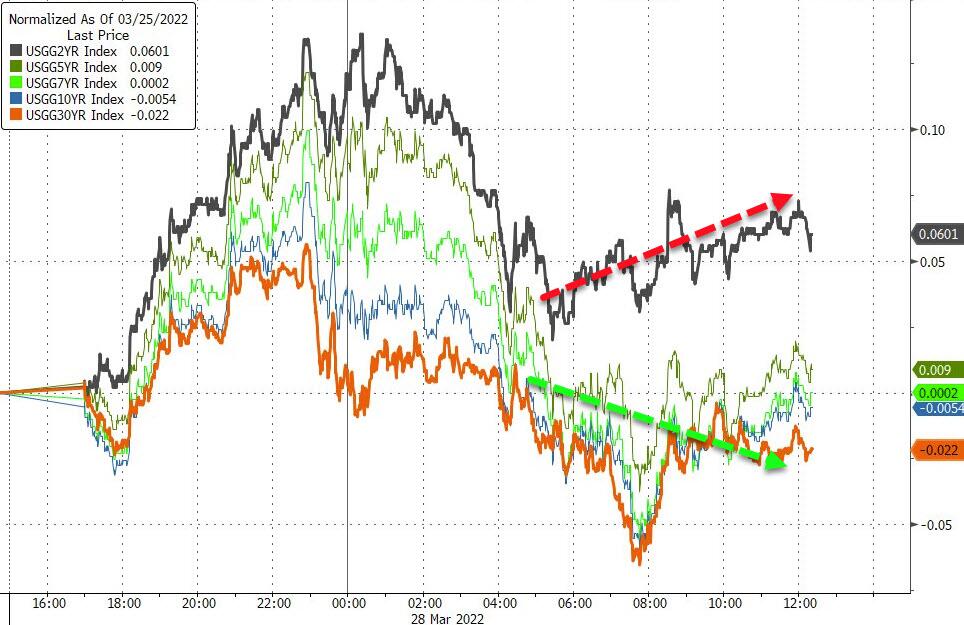
Nevertheless, this turnaround pushed Crude Oil, the Energy sector and Gold lower, while bond yields fell modestly.
Analyst Edward Moya added these words of wisdom:
Geopolitical risks remain very elevated and the rally in equities over the past two weeks is impressive. The U.S. economy is still in good shape but buying every stock market dip probably won’t be the attitude for most traders going forward given how hawkish the Fed has turned.
That’s my sentiment exactly, because if the Fed is truly serious in its inflation fighting efforts via higher interest rates, the days for the stock market bulls are numbered. However, if the Fed caves again in its hiking efforts, as the bears take the upper hand, we may see a reversal in policy just like in late 2018, after which the bull market continued with full force.
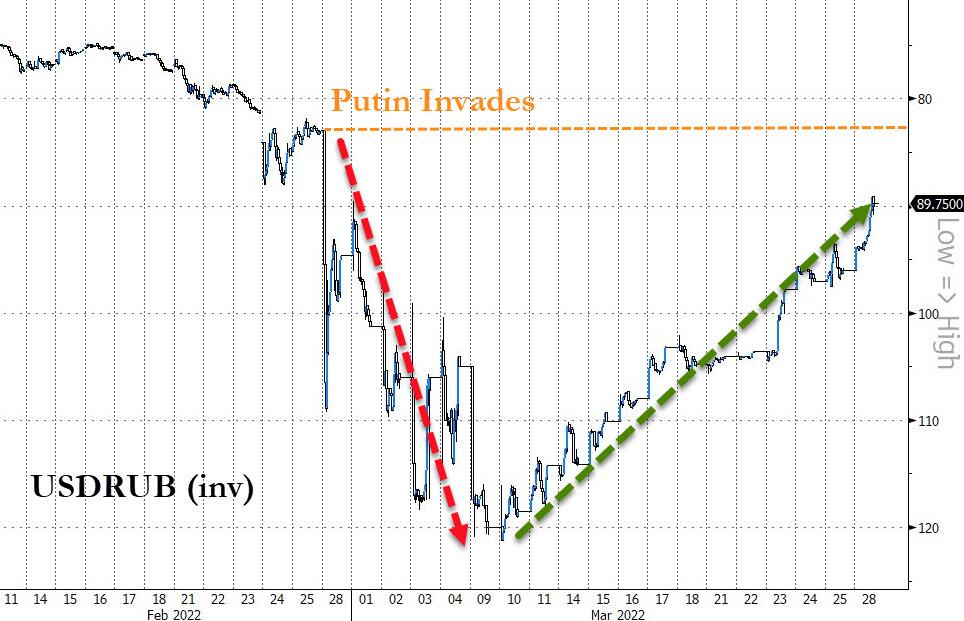
It’s interesting to note that the Russian Ruble, which got hammered into oblivion, finally stopped the bleeding, reversed course and almost wiped out all “invasion” gains. The US Dollar came back to life and rallied to 2-week highs.
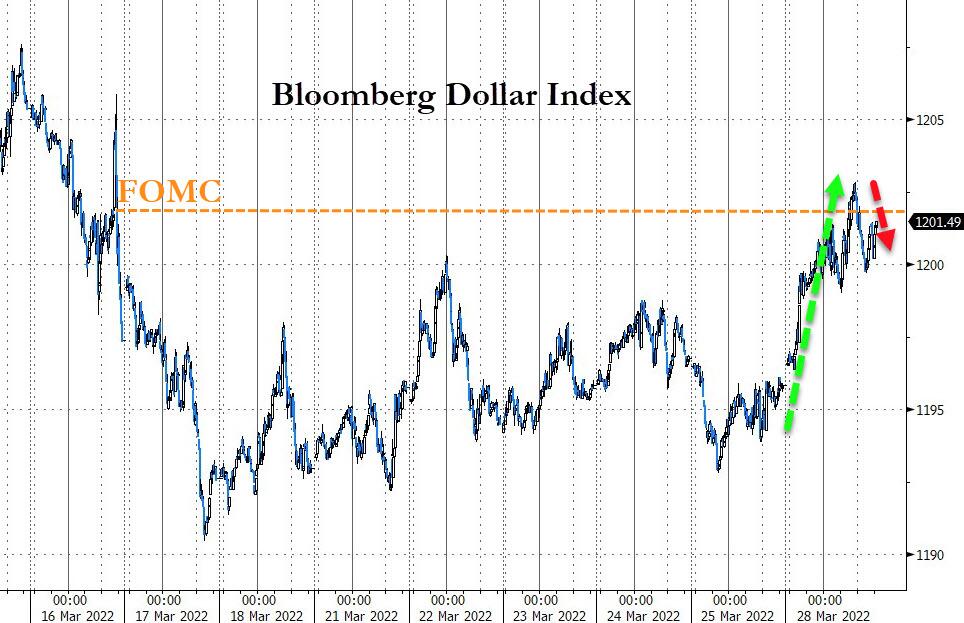
What is most incredible, as ZeroHedge pointed out, is that the market is now pricing in 9 more rate hikes in 2022, which the market sees a guaranteeing a recession…and therefore the market is pricing in almost 3 rate cuts in 2023/24.
That’s why you are seeing the current rally not running out of steam—yet.
2. ETFs in the Spotlight
In case you missed the announcement and description of this section, you can read it here again.
It features some of the 10 broadly diversified domestic and sector ETFs from my HighVolume list as posted every Saturday. Furthermore, they are screened for the lowest MaxDD% number meaning they have been showing better resistance to temporary sell offs than all others over the past year.
The below table simply demonstrates the magnitude with which these ETFs are fluctuating above or below their respective individual trend lines (%+/-M/A). A break below, represented by a negative number, shows weakness, while a break above, represented by a positive percentage, shows strength.
For hundreds of ETF choices, be sure to reference Thursday’s StatSheet.
For this just closed-out domestic “Buy” cycle, here’s how some of our candidates have fared:
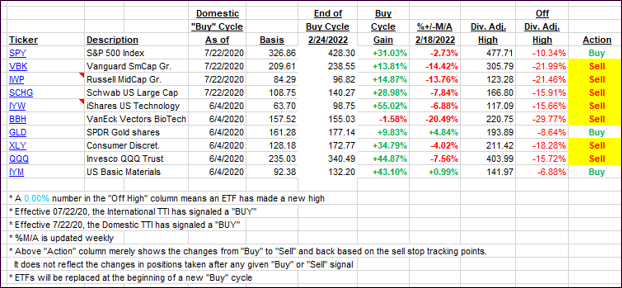
Click image to enlarge.
Again, the %+/-M/A column above shows the position of the various ETFs in relation to their respective long-term trend lines, while the trailing sell stops are being tracked in the “Off High” column. The “Action” column will signal a “Sell” once the -12% point has been taken out in the “Off High” column, which has replaced the prior -8% to -10% limits.
3. Trend Tracking Indexes (TTIs)
Our TTIs changed only immaterially, so no adjustments to our current signals.
This is how we closed 03/28/2022:
Domestic TTI: +2.50% above its M/A (prior close +2.19%)—Sell signal effective 02/24/2022.
International TTI: +0.88% above its M/A (prior close +1.04%)—Sell signal effective 03/08/2022.
Disclosure: I am obliged to inform you that I, as well as my advisory clients, own some of the ETFs listed in the above table. Furthermore, they do not represent a specific investment recommendation for you, they merely show which ETFs from the universe I track are falling within the specified guidelines.
All linked charts above are courtesy of Bloomberg via ZeroHedge.
Contact Ulli