
- Moving the markets
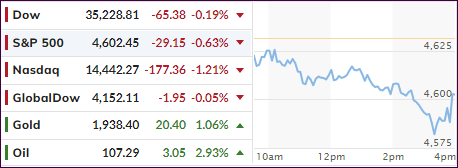
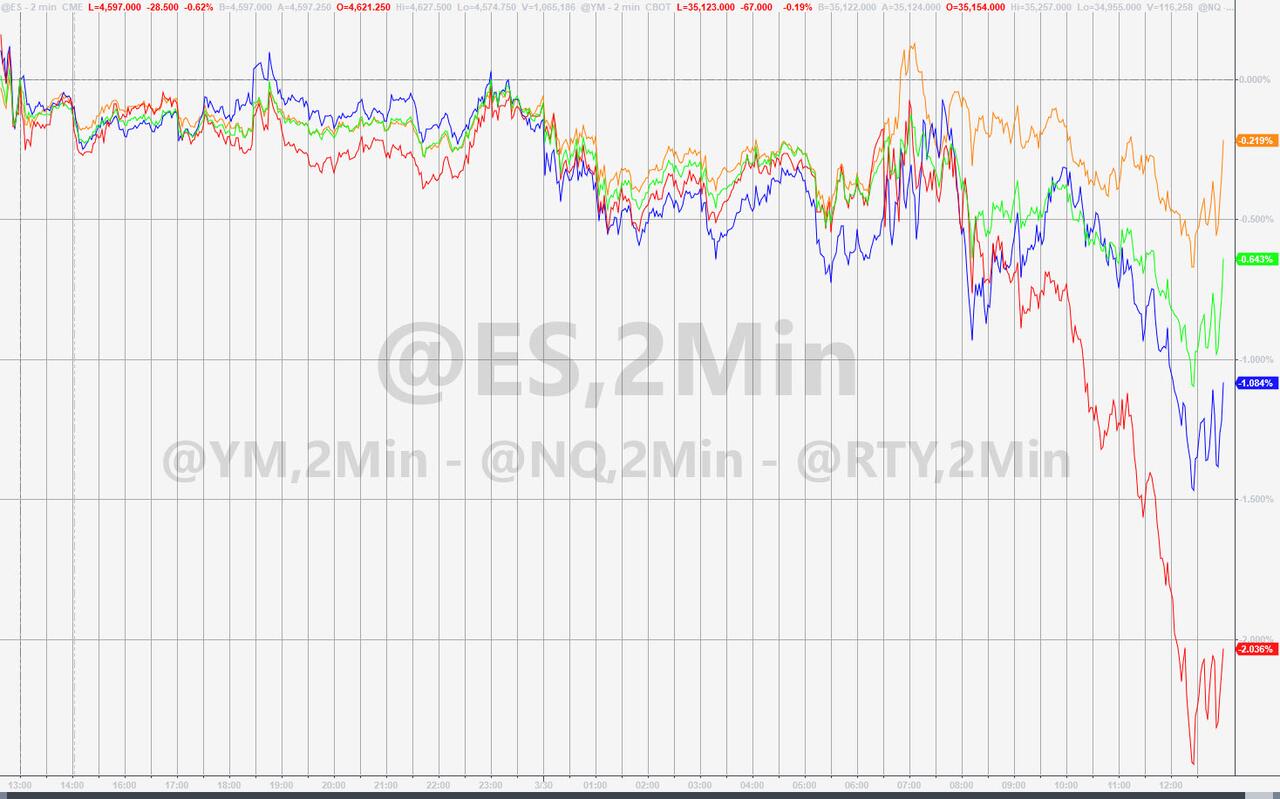
While the Dow peeked above its unchanged line early on, that visit was an ephemeral one because the index shortly thereafter joined the S&P 500 and Nasdaq in the red. The slipping and sliding continued throughout the session with dip buyers being conspicuously absent.
Things got worse mid-day after Russia reported that they were ready for a “final stage” of the Donbas liberation and that other tasks had been completed, as ZH reported:
The markets having soared on optimism yesterday amid chatter of Russian forces retreating, Ukrainian President Zelensky poured some cold water on that hope by noting that Russia is sending new forces during a speech to the Norwegian parliament. He also warned that he sees risk in the Black Sea from Russian mines.
His comments follow a statement from the Kremlin said there are no breakthroughs in talks with Ukraine.
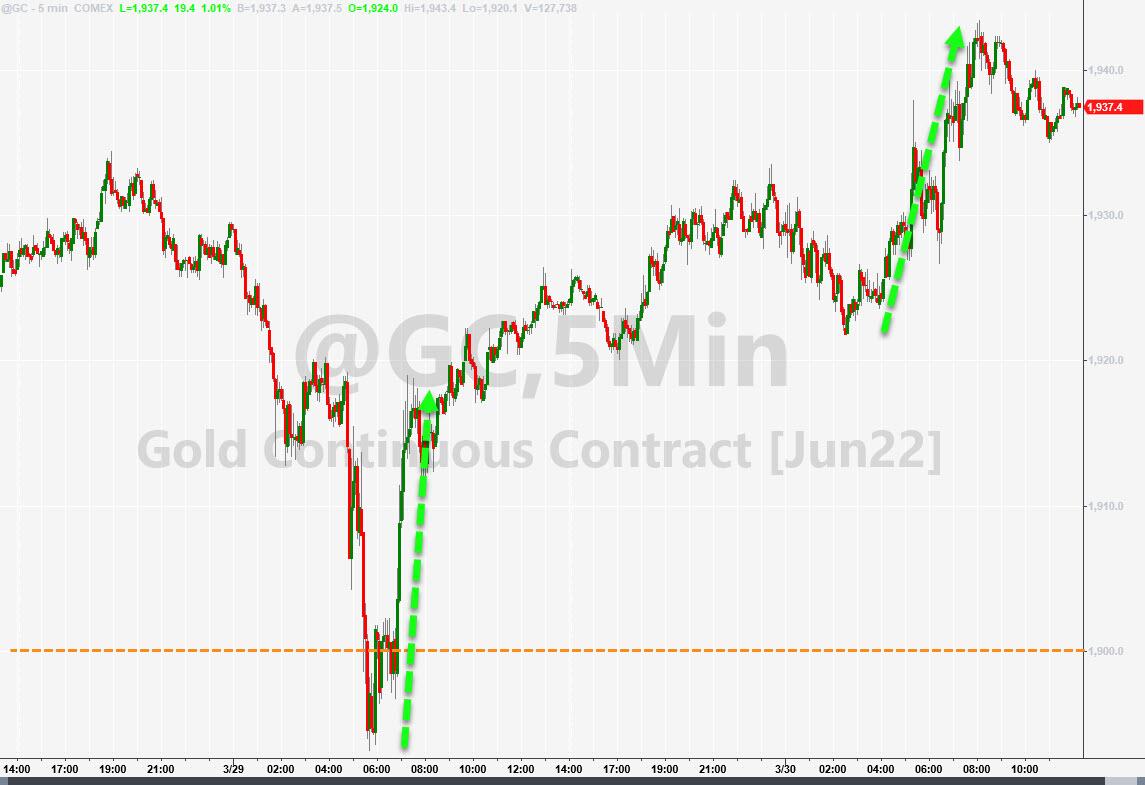
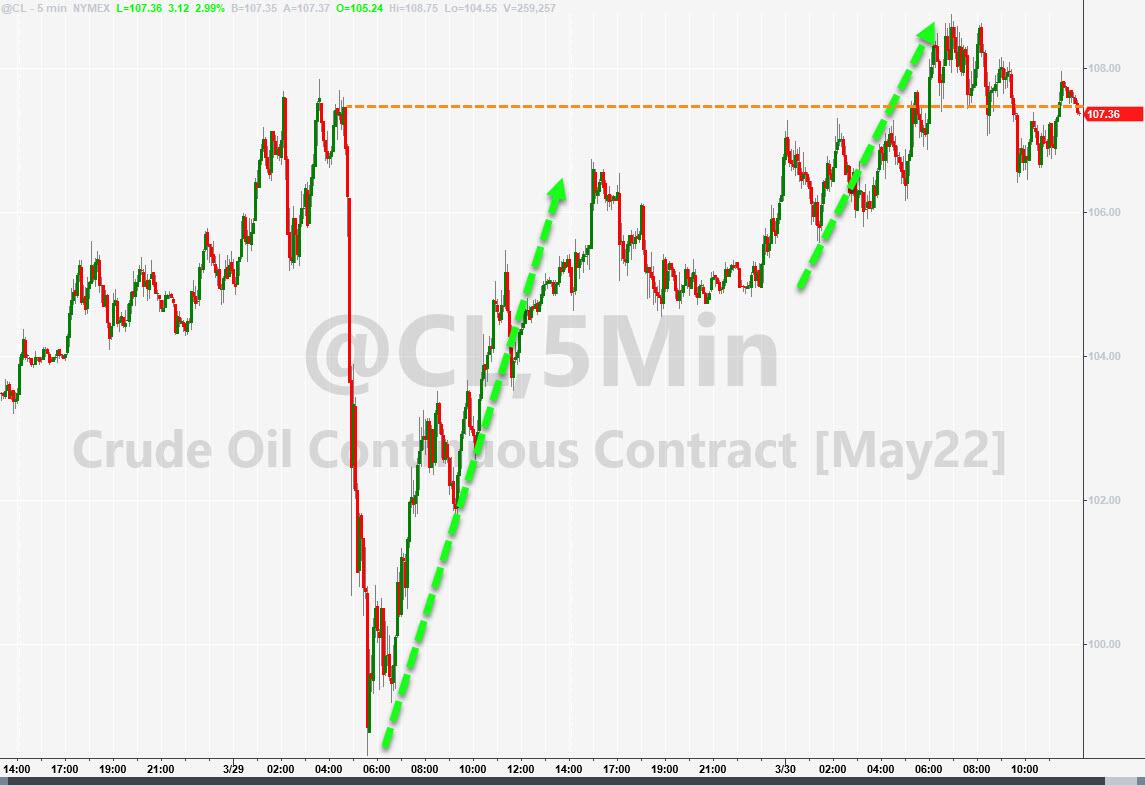
That was good news for Gold, with precious metal jumping and closing the day with a +1.15% gain, while Crude Oil joined the party by advancing +2.84%.
And just like that, yesterday’s peace optimism got put on hold assisted by some hawkish talk by various Fed mouth pieces. Even a decent ADP jobs report could not offset the reality of the moment. A short squeeze attempt hit a brick wall leaving the major indexes to follow the path of least resistance.
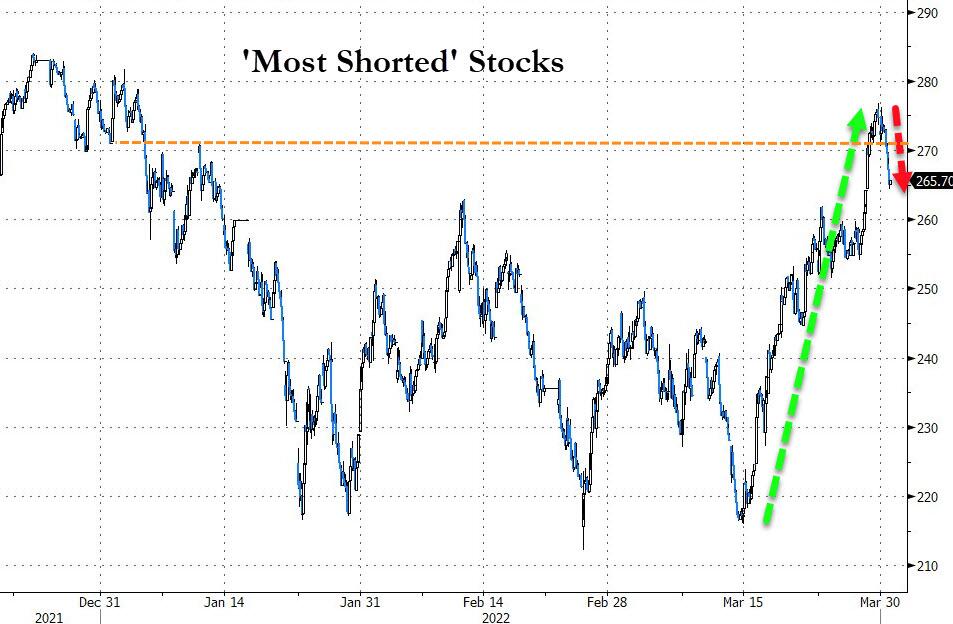
For a change, bond yields backed off their recent highs with the 10-year dropping 5 bps. The US Dollar fell back to almost touch the lows of the month.
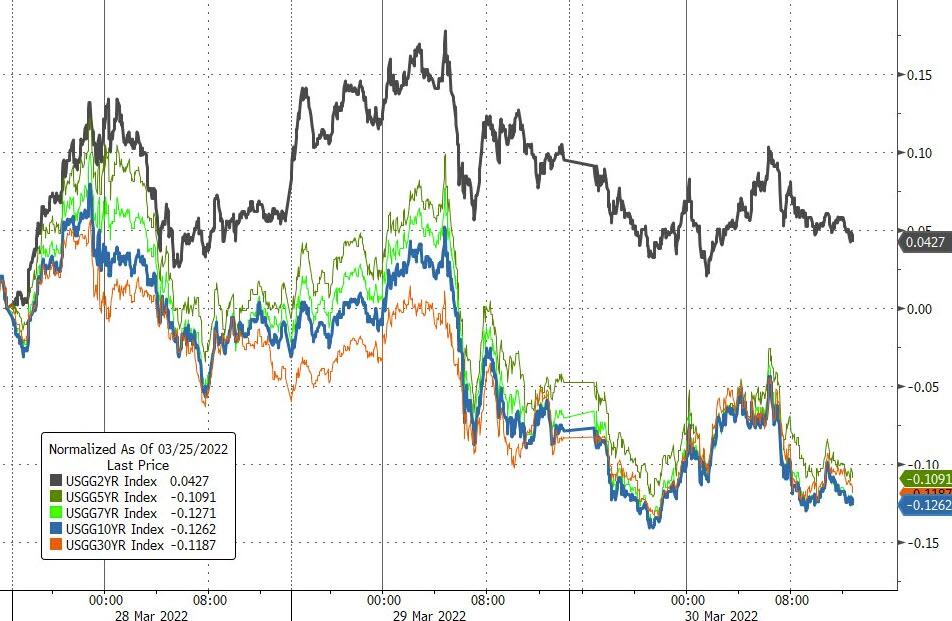
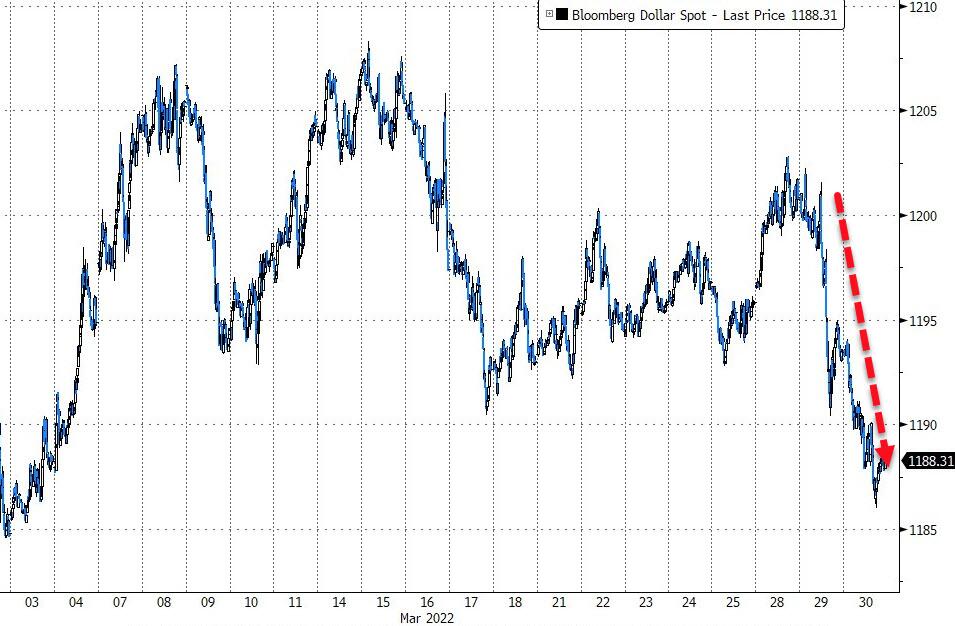
In terms of future rate hikes, and subsequent rate cuts, this chart presents the latest update with the markets now expecting 9 more hikes in 2022, creating a recession, which then will be followed by 3 cuts in 2023/24. The latter is what stocks have been focusing on.
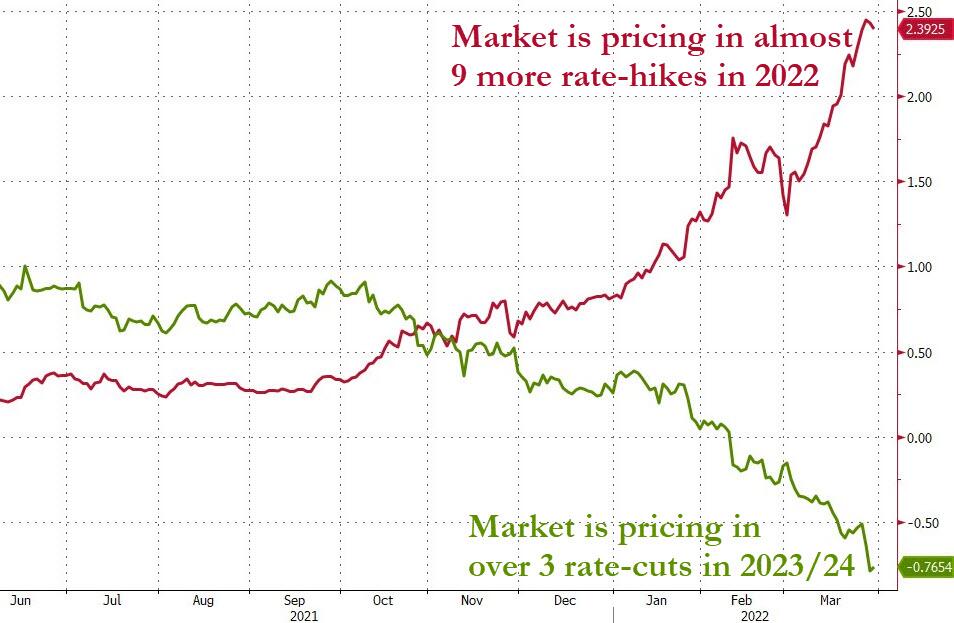
2. ETFs in the Spotlight
In case you missed the announcement and description of this section, you can read it here again.
It features some of the 10 broadly diversified domestic and sector ETFs from my HighVolume list as posted every Saturday. Furthermore, they are screened for the lowest MaxDD% number meaning they have been showing better resistance to temporary sell offs than all others over the past year.
The below table simply demonstrates the magnitude with which these ETFs are fluctuating above or below their respective individual trend lines (%+/-M/A). A break below, represented by a negative number, shows weakness, while a break above, represented by a positive percentage, shows strength.
For hundreds of ETF choices, be sure to reference Thursday’s StatSheet.
For this just closed-out domestic “Buy” cycle, here’s how some of our candidates have fared:
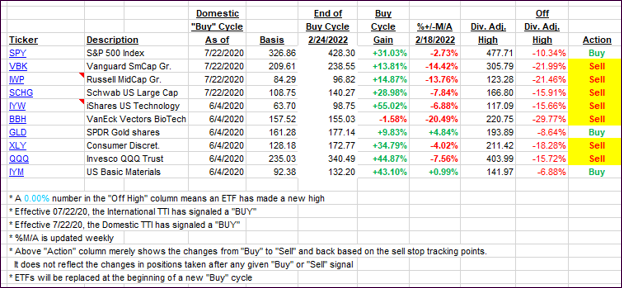
Click image to enlarge.
Again, the %+/-M/A column above shows the position of the various ETFs in relation to their respective long-term trend lines, while the trailing sell stops are being tracked in the “Off High” column. The “Action” column will signal a “Sell” once the -12% point has been taken out in the “Off High” column, which has replaced the prior -8% to -10% limits.
3. Trend Tracking Indexes (TTIs)
Our TTIs lost momentum, as lack of optimism of a quick “Ukraine solution” pulled the markets down. We saw red numbers all day, which made me hold off in issuing a new “Buy” signal. With tomorrow being the last day of the quarter, I will not consider any changes until next week, when Q2 gets under way.
This is how we closed 03/30/2022:
Domestic TTI: +3.35% above its M/A (prior close +4.20%)—Sell signal effective 02/24/2022.
International TTI: +2.20% above its M/A (prior close +2.20%)—Sell signal effective 03/08/2022.
Disclosure: I am obliged to inform you that I, as well as my advisory clients, own some of the ETFs listed in the above table. Furthermore, they do not represent a specific investment recommendation for you, they merely show which ETFs from the universe I track are falling within the specified guidelines.
All linked charts above are courtesy of Bloomberg via ZeroHedge.
Contact Ulli