
- Moving the markets
Last week’s enthusiastic rally, in the face of nothing but geopolitical and economic issues, came to an end today when Fed Head Powell rang the bell on inflationary concerns while hinting at tougher responses.
After finally admitting that “inflation is much too high,” he vowed to take appropriate measures to get a better grip on prices. That pledge would take form via more aggressively hiking rates at the tune of 50 bps, should the need arise, rather than the 25 bps that had been widely circulated.
The Fed must have had some sort of awakening, with this announcement coming only a week after the first 25 bps rate hike since 2018. Here are some Fed-speak snippets as presented by ZH:
- *BOSTIC SAYS HE’S NOT WEDDED TO ONLY MOVE RATES IN 25 BPS STEPS
- *BOSTIC SAYS FED SHOULD GET MOVING `QUICKLY’ ON BALANCE SHEET
- *BARKIN: CAN MOVE AT 50 BP CLIP AGAIN TO TAME INFLATION
- *BARKIN: WE COULD MOVE FASTER, BUT ALREADY IMPACTING BOND MARKET
Commented Morgan Stanley’s Mike Wilson:
The rally in equities over the past week was one of the sharpest on record. While it could go a bit higher … we remain convinced it’s still a bear market, and we would use this strength to position more defensively.
My sentiments exactly. Because if the Fed is truly serious and follows through with hiking rates in manner that will have a noticeable effect on controlling inflation, stocks will come off their lofty levels and soon confirm that a bearish trend is in the making.
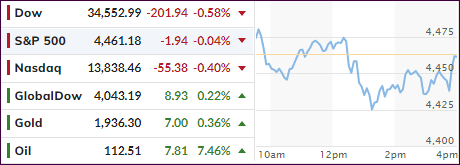
In the end, the pullback was moderate with the S&P 500 bouncing back to its unchanged line. That surprised most traders, as bond investors got spanked with the 10-year spiking an astonishing 15 bps to close at 2.305%.
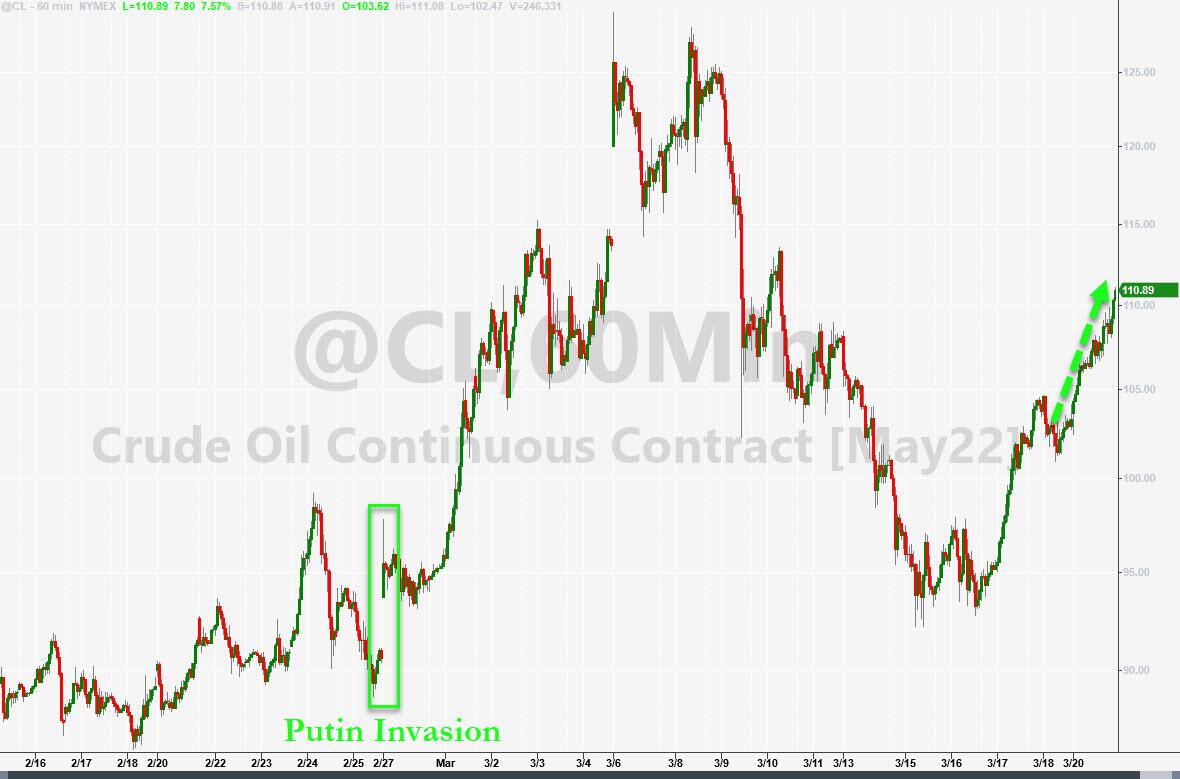
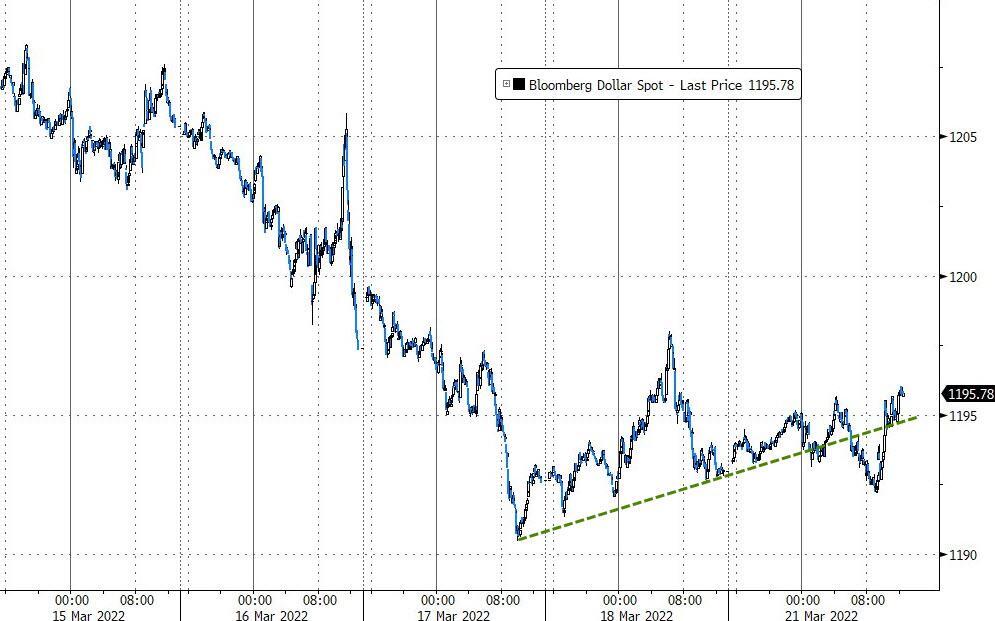
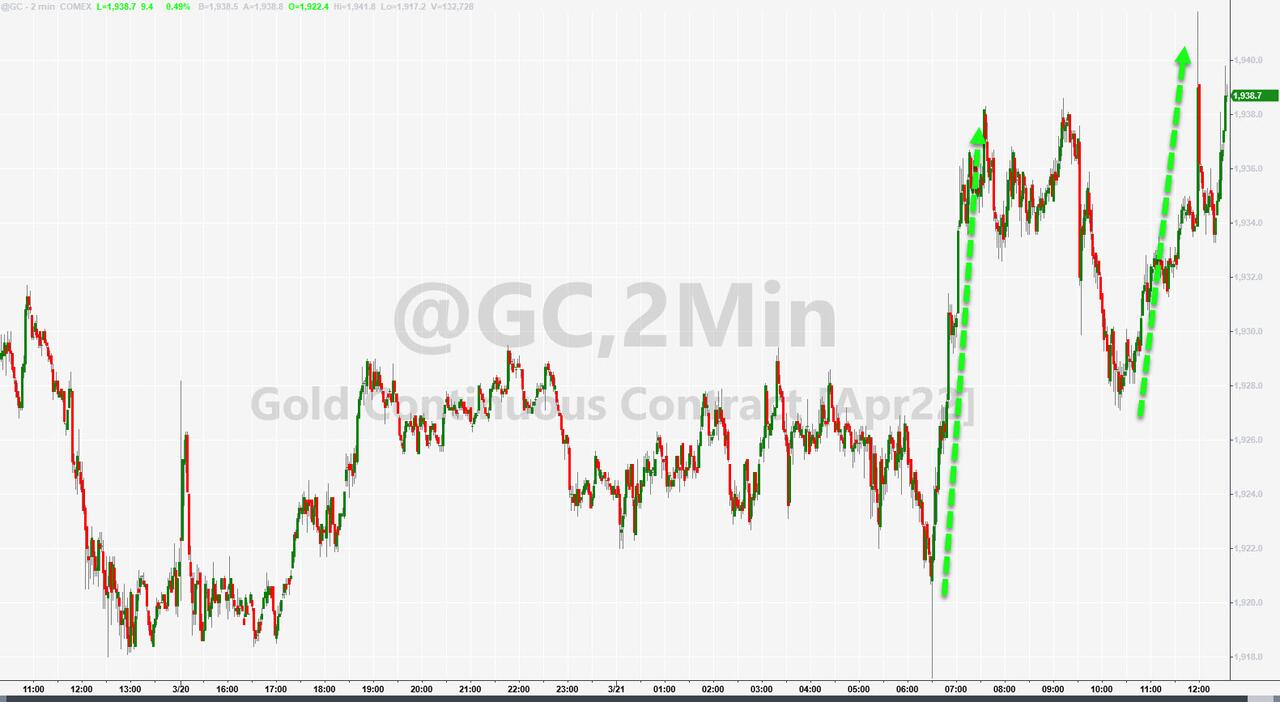
Crude oil prices soared over 7% to $112, the US Dollar inched higher, while Gold pumped, dumped, and pumped to closer higher by +0.33%.
Here’s Zero Hedge’s market comparison to 2018, when the Fed last raised rates, crushing the markets in the process, only to reverse their hawkish stance and bring the bullish theme back into play.
Will we see a replay?
2. ETFs in the Spotlight
In case you missed the announcement and description of this section, you can read it here again.
It features some of the 10 broadly diversified domestic and sector ETFs from my HighVolume list as posted every Saturday. Furthermore, they are screened for the lowest MaxDD% number meaning they have been showing better resistance to temporary sell offs than all others over the past year.
The below table simply demonstrates the magnitude with which these ETFs are fluctuating above or below their respective individual trend lines (%+/-M/A). A break below, represented by a negative number, shows weakness, while a break above, represented by a positive percentage, shows strength.
For hundreds of ETF choices, be sure to reference Thursday’s StatSheet.
For this just closed-out domestic “Buy” cycle, here’s how some of our candidates have fared:
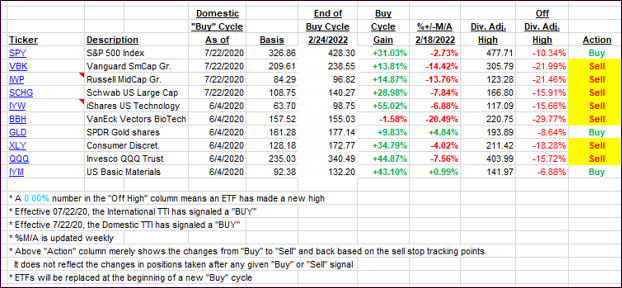
Click image to enlarge.
Again, the %+/-M/A column above shows the position of the various ETFs in relation to their respective long-term trend lines, while the trailing sell stops are being tracked in the “Off High” column. The “Action” column will signal a “Sell” once the -12% point has been taken out in the “Off High” column, which has replaced the prior -8% to -10% limits.
3. Trend Tracking Indexes (TTIs)
Our TTIs slipped as the Fed hawkish tone cause bond yields to spike and equites to pull back. While I took the opportunity to add a value component to our holdings, the Domestic TTI is barely hanging to bullish territory and can easily drop back to other side. Hence, I will hold off announcing a new “Buy” until I see more staying power or increased depth above the line.
This is how we closed 03/21/2022:
Domestic TTI: +0.66% above its M/A (prior close +1.37%)—Sell signal effective 02/24/2022.
International TTI: -0.44% below its M/A (prior close -0.64%)—Sell signal effective 03/08/2022.
Disclosure: I am obliged to inform you that I, as well as my advisory clients, own some of the ETFs listed in the above table. Furthermore, they do not represent a specific investment recommendation for you, they merely show which ETFs from the universe I track are falling within the specified guidelines.
All linked charts above are courtesy of Bloomberg via ZeroHedge.
Contact Ulli