
- Moving the markets
Starting a rumor is always a good way to keep a rally from falling apart, especially prior to one of the most eagerly awaited announcements, namely tomorrow’s CPI. Such was the case last night when, according to ZH, JPM heard “whispers of CPI below expectations,” which gave the bulls a running start.
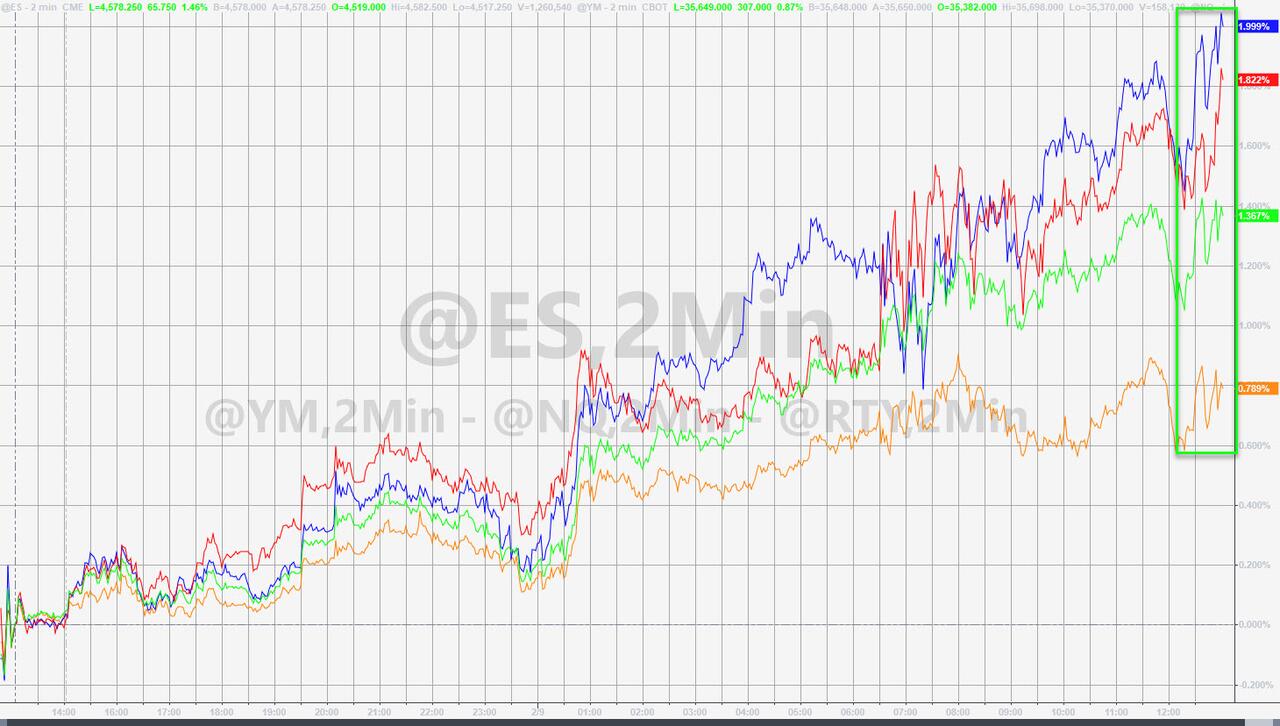
That was enough of a spark to motivate traders and computer algos to front run tomorrow’s event in the hope that the CPI comes in lower, thereby giving the Fed less ammo to raise interest rates and keep the bullish dream alive.
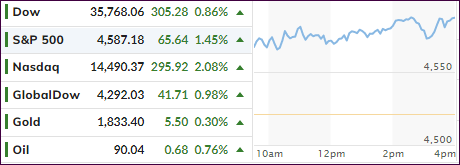
The inflation data is estimated to show that prices rose 0.4% in January, for a 7.2% gain from one year ago, according to Dow Jones.
As a result of today’s rumor, bond yields, which had surged throughout this year, eased up with the benchmark 10-year coming off its recent high of 1.97% to end the session at 1.95%.
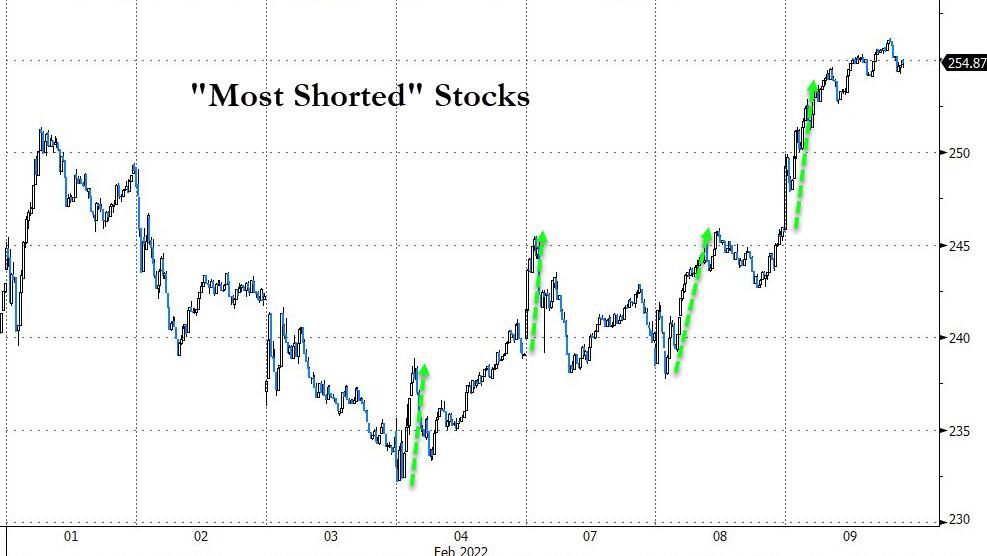
Of course, big rallies do not simply develop on their own, they need an assist, which came today via another short squeeze. As ZH explained, the most shorted stocks are up 4 straight days, over 9%, which is the biggest squeeze since late October.
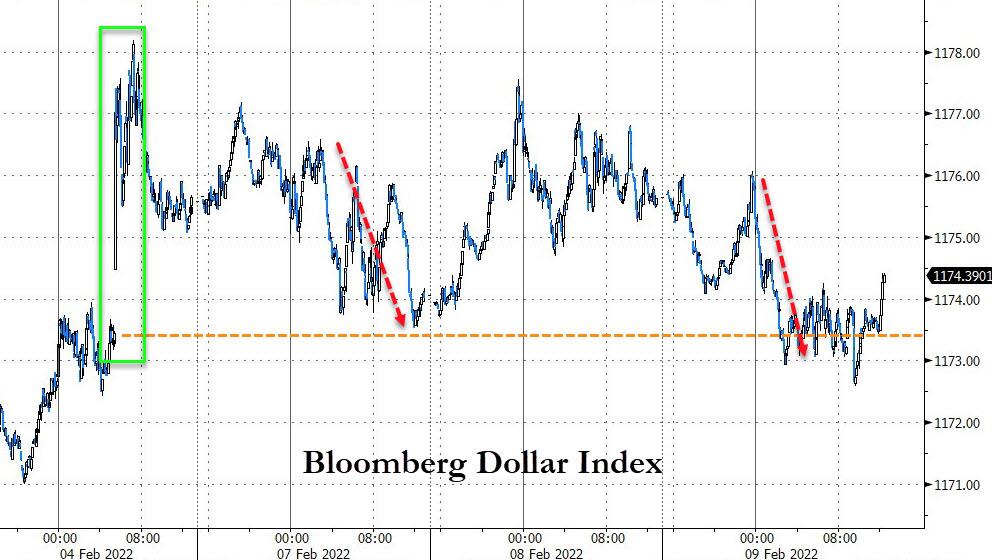
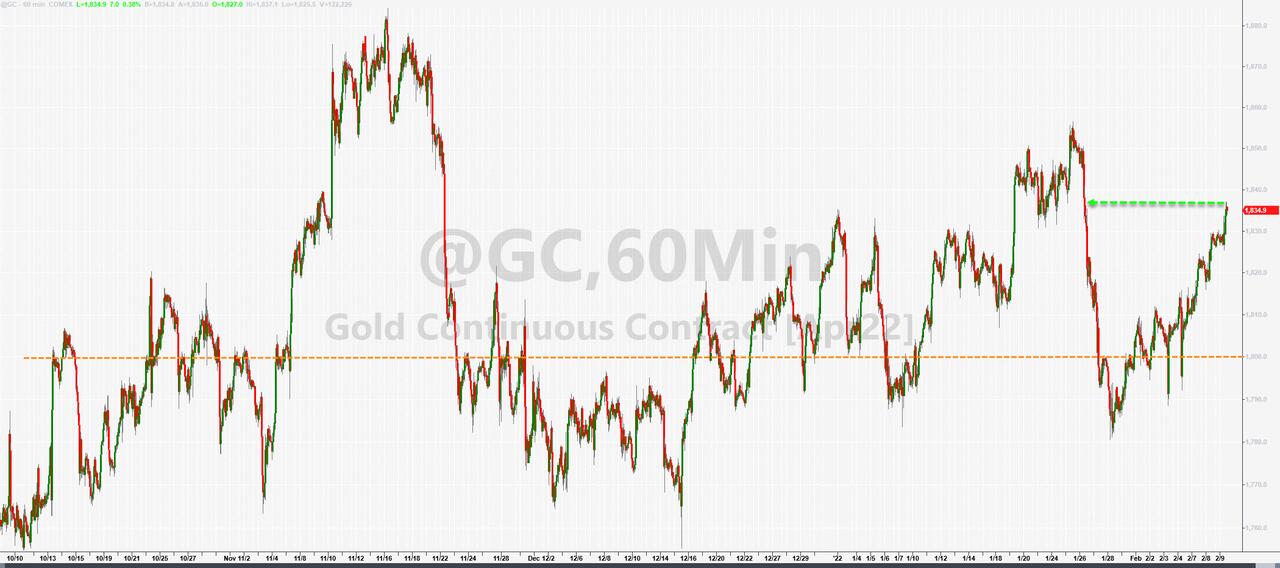
The US Dollar slipped again, while gold showed some steadiness by being up 8 of the last 9 days.
We will also find out tomorrow if the well-worn adage “buy the rumor, sell the fact” can still be applied.
2. ETFs in the Spotlight
In case you missed the announcement and description of this section, you can read it here again.
It features some of the 10 broadly diversified domestic and sector ETFs from my HighVolume list as posted every Saturday. Furthermore, they are screened for the lowest MaxDD% number meaning they have been showing better resistance to temporary sell offs than all others over the past year.
The below table simply demonstrates the magnitude with which these ETFs are fluctuating above or below their respective individual trend lines (%+/-M/A). A break below, represented by a negative number, shows weakness, while a break above, represented by a positive percentage, shows strength.
For hundreds of ETF choices, be sure to reference Thursday’s StatSheet.
For this current domestic “Buy” cycle, here’s how some of our candidates have fared:
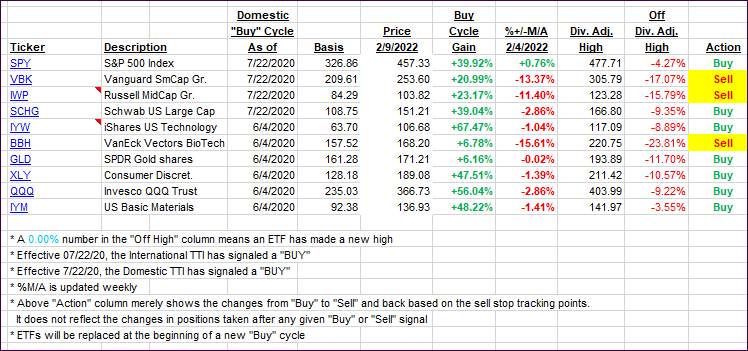
Click image to enlarge.
Again, the %+/-M/A column above shows the position of the various ETFs in relation to their respective long-term trend lines, while the trailing sell stops are being tracked in the “Off High” column. The “Action” column will signal a “Sell” once the -12% point has been taken out in the “Off High” column, which has replaced the prior -8% to -10% limits.
3. Trend Tracking Indexes (TTIs)
Our TTIs jumped as the rumor mill and a short squeeze pushed the broad market higher.
This is how we closed 02/09/2022:
Domestic TTI: +3.67% above its M/A (prior close +1.94%)—Buy signal effective 07/22/2020.
International TTI: +5.70% above its M/A (prior close +4.69%)—Buy signal effective 07/22/2020.
Disclosure: I am obliged to inform you that I, as well as my advisory clients, own some of the ETFs listed in the above table. Furthermore, they do not represent a specific investment recommendation for you, they merely show which ETFs from the universe I track are falling within the specified guidelines.
All linked charts above are courtesy of Bloomberg via ZeroHedge.
Contact Ulli