
- Moving the markets
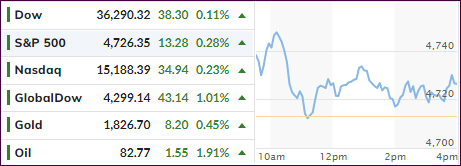
An early pump ran into strong resistance with the major indexes suddenly reversing and even breaking their respective unchanged lines to the downside. Fortunately, dip buyers stepped in and saved the markets from closing in the red.
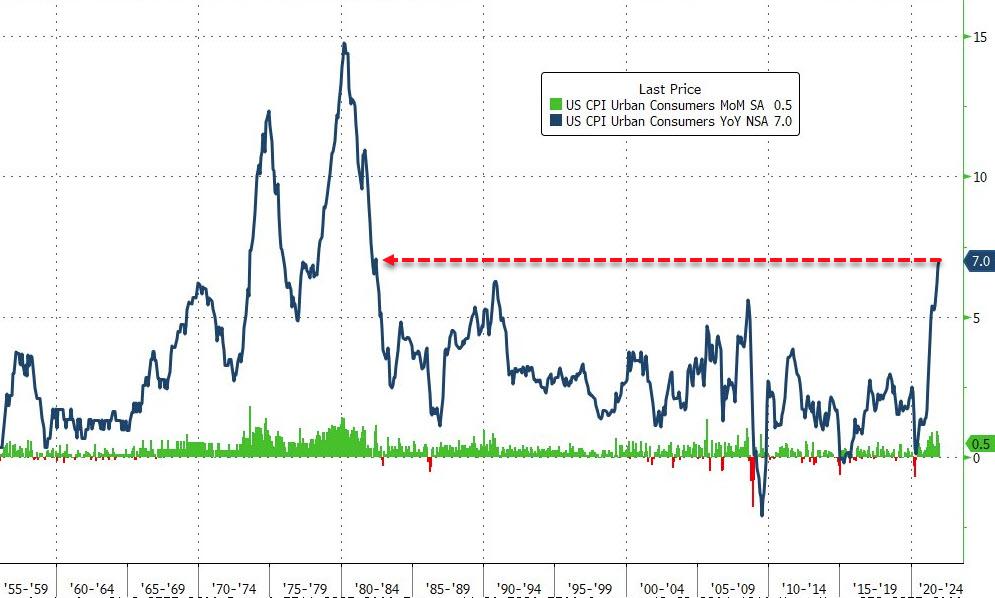
The much-anticipated Consumer Price Index (CPI) showed an amazing 7% YoY ramp, which was in line with expectations, despite it being the biggest jump since 1982. It also has the dubious distinction of representing its 19th straight monthly rise.
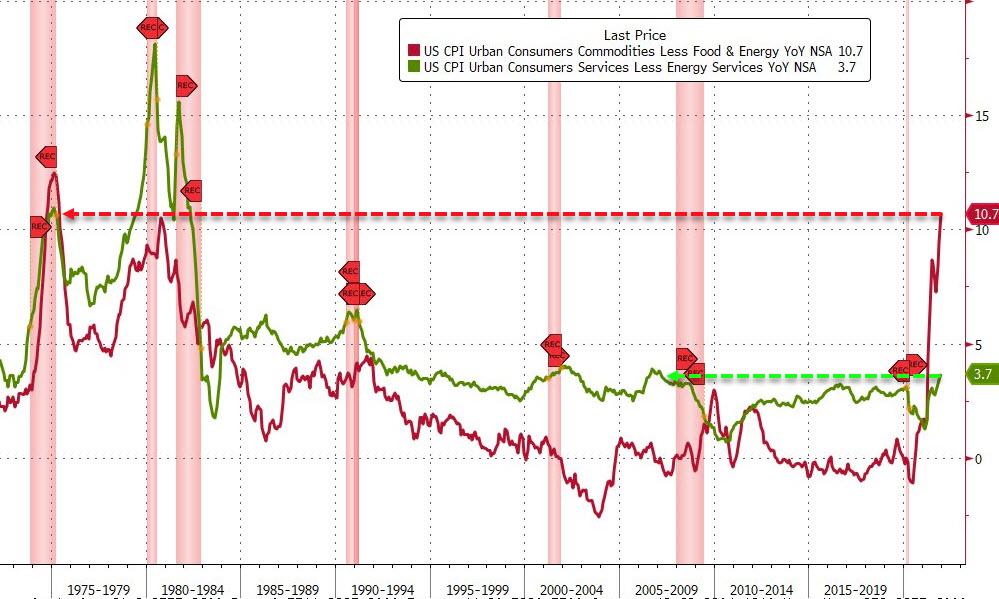
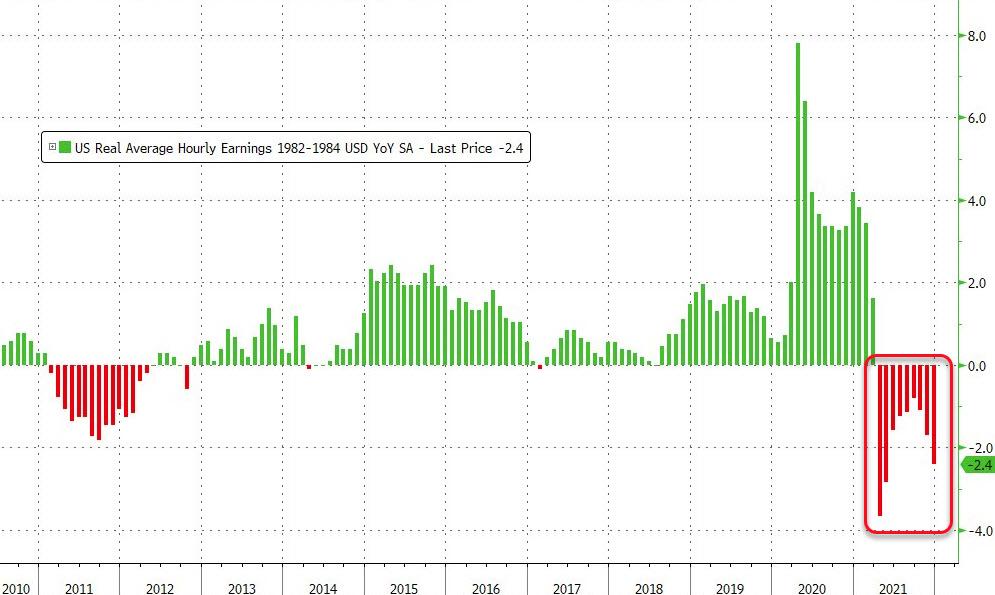
ZeroHedge drilled down a little further and reported that the Services inflation rose to 3.7%, it’s highest since January 2007, while Goods inflation soared 10.7% YoY, its highest since 1975. All this in the face of real hourly earnings falling (down 2.4% YoY) for the 9th straight month. Ouch!
Given the above, it came as a surprise to see bond yields slide a tad, as an opposite reaction would have been a more appropriate move, especially after the Fed’s main mouth piece went into hawkish mode:
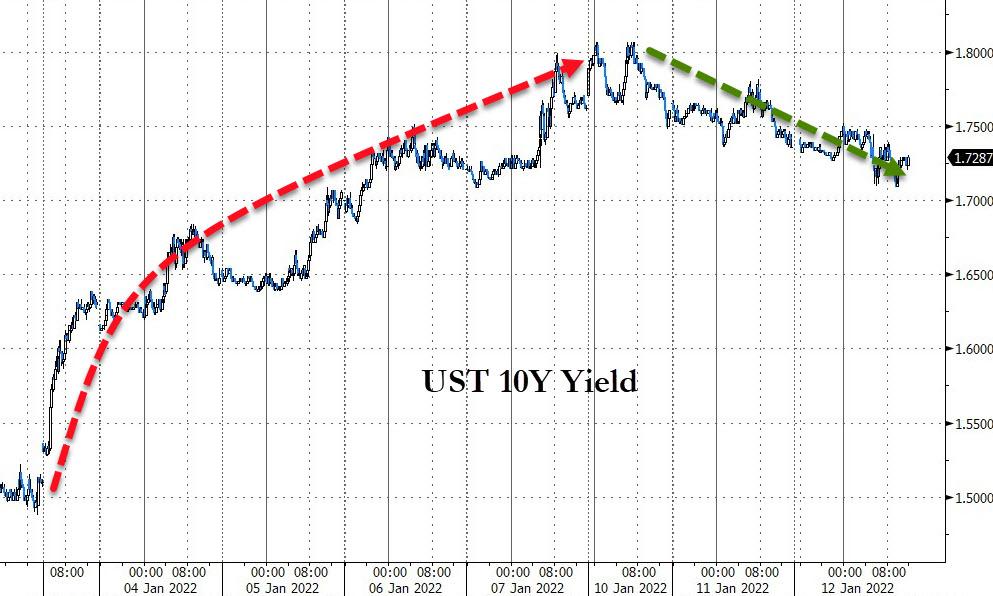
- Fed’s Bullard: Four Rate Rises in 2022 Now Appear Likely –WSJ
- Bullard: 2021 Liquidity Can Be Removed With Likely Little Disruption –WSJ
- Bullard: Early Start to Rate Hikes May Avoid More Hawkish Rate Path –WSJ
- Bullard: March Rate Rise Is Very Likely Amid High Inflation –WSJ
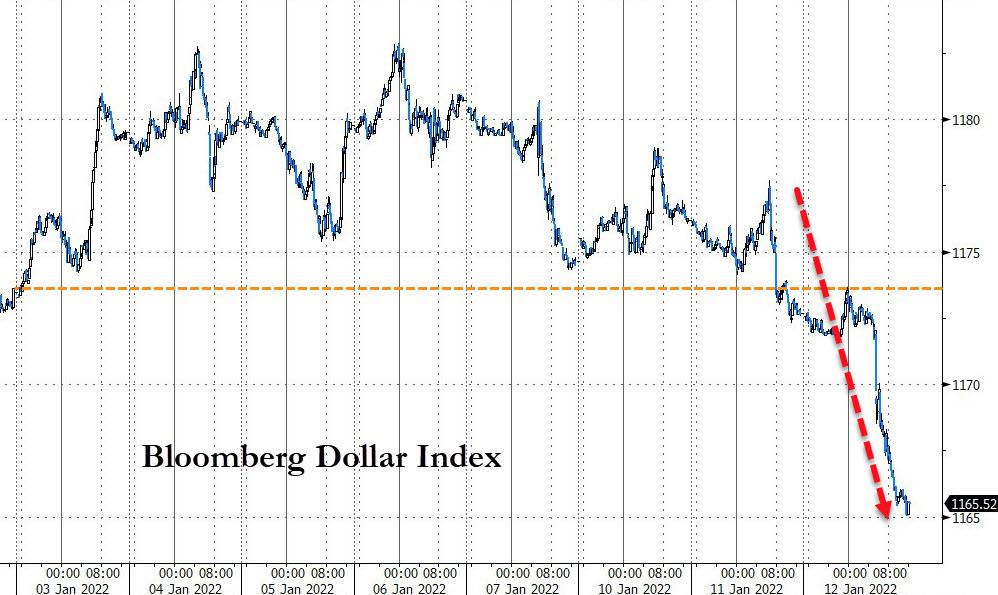
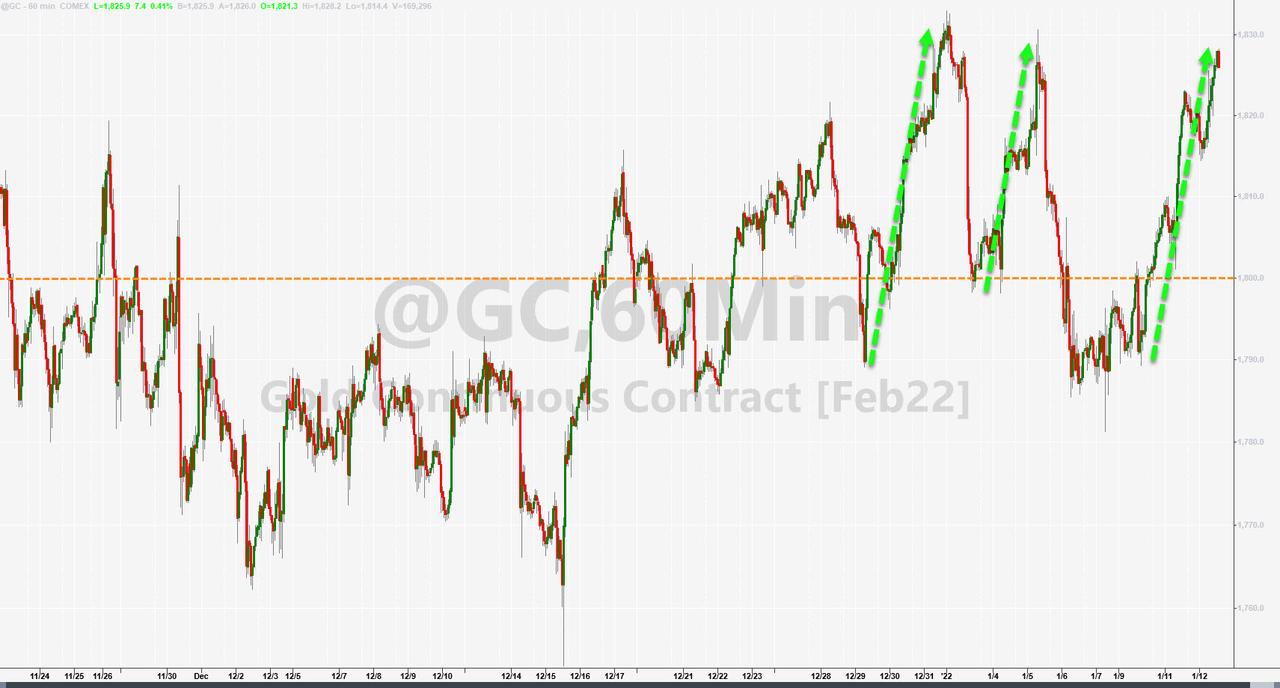
The weakness in bond yields was followed by a dump in the US Dollar, both of which combined forces to keep the gold rally alive.
Earnings season is on deck and will start tomorrow with the big banks releasing their report cards. I’ll be back on Friday with the week-ending commentary.
2. ETFs in the Spotlight
In case you missed the announcement and description of this section, you can read it here again.
It features some of the 10 broadly diversified domestic and sector ETFs from my HighVolume list as posted every Saturday. Furthermore, they are screened for the lowest MaxDD% number meaning they have been showing better resistance to temporary sell offs than all others over the past year.
The below table simply demonstrates the magnitude with which these ETFs are fluctuating above or below their respective individual trend lines (%+/-M/A). A break below, represented by a negative number, shows weakness, while a break above, represented by a positive percentage, shows strength.
For hundreds of ETF choices, be sure to reference Thursday’s StatSheet.
For this current domestic “Buy” cycle, here’s how some of our candidates have fared:
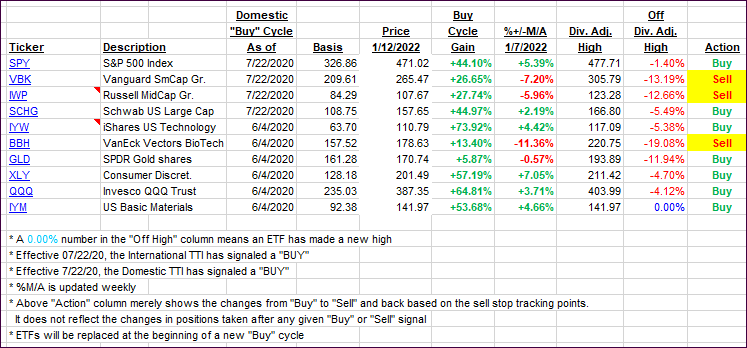
Click image to enlarge.
Again, the %+/-M/A column above shows the position of the various ETFs in relation to their respective long-term trend lines, while the trailing sell stops are being tracked in the “Off High” column. The “Action” column will signal a “Sell” once the -12% point has been taken out in the “Off High” column, which has replaced the prior -8% to -10% limits.
3. Trend Tracking Indexes (TTIs)
Even though our TTIs both rose, the International one displayed more upward momentum and currently has exceeded the Domestic one in terms of having moved deeper into bullish territory.
This is how we closed 01/12/2022:
Domestic TTI: +5.75% above its M/A (prior close +5.66%)—Buy signal effective 07/22/2020.
International TTI: +6.30% above its M/A (prior close 5.35%)—Buy signal effective 07/22/2020.
Disclosure: I am obliged to inform you that I, as well as my advisory clients, own some of the ETFs listed in the above table. Furthermore, they do not represent a specific investment recommendation for you, they merely show which ETFs from the universe I track are falling within the specified guidelines.
All linked charts above are courtesy of Bloomberg via ZeroHedge.
Contact Ulli