
- Moving the markets
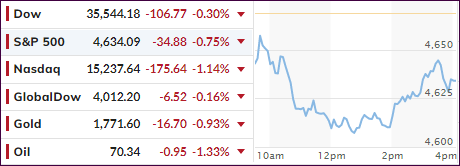
There was simply too much uncertainty swirling around Wall Street to give the bulls any encouragement to pull the major indexes out of yesterday’s doldrums, so the bears dominated the session again.
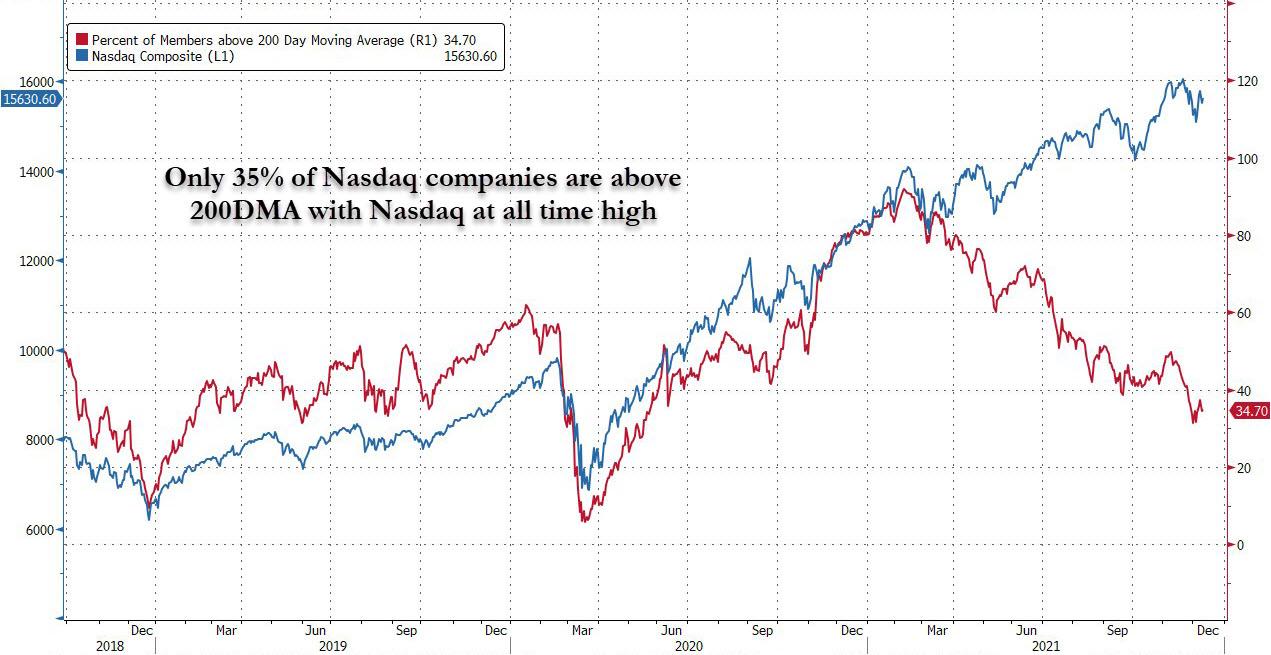
First, there was Goldman Sachs ringing the alarm bell by stating their worry about market breadth. Zero Hedge noted that it means 51% of all market gains since April have come from just 5 stocks, and only 35% of Nasdaq companies are above their 200-day M/A, with the Nasdaq at all-time highs. Ouch!
Second, traders are nervous about Friday’s quad options expirations, the volume of which is pegged to $4.3 trillion in estimated value. This will certainly add to volatility, as will some other factors.
We will face the outcome of the Fed meeting tomorrow regarding the much-announced acceleration of the tapering of bond purchases, as well as any potential rate hikes. This will be followed by Thursday’s jobless numbers and the above-mentioned options expirations on Friday, all of which could combine to create a tumultuous week.
Given the above, and the fact that bond yields edged higher today, it’s no surprise that equities gave back some of last week’s gains with the Nasdaq and SmallCaps getting hit the hardest.
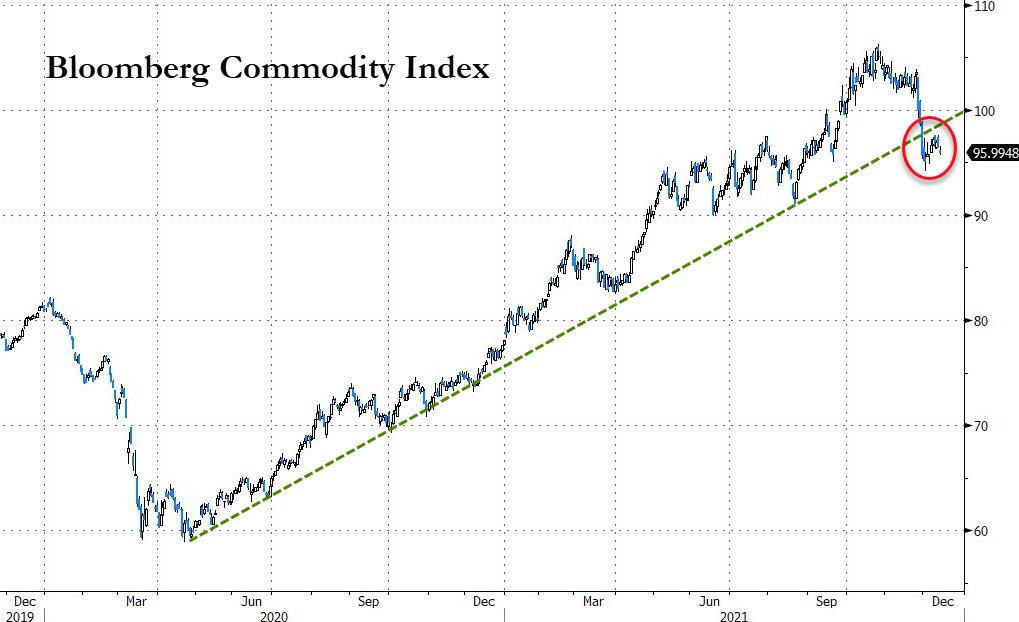
The US Dollar continued its stairstep rebound and added 0.26% for the session, while the Commodity Index, which had been on a tear since April 2020, showed signs of weakening by breaking below its major uptrend line.
Even gold, a place to hide during times of uncertainty, offered no refuge, and the precious metal was slammed at the tune of 0.93%.
2. ETFs in the Spotlight
In case you missed the announcement and description of this section, you can read it here again.
It features some of the 10 broadly diversified domestic and sector ETFs from my HighVolume list as posted every Saturday. Furthermore, they are screened for the lowest MaxDD% number meaning they have been showing better resistance to temporary sell offs than all others over the past year.
The below table simply demonstrates the magnitude with which these ETFs are fluctuating above or below their respective individual trend lines (%+/-M/A). A break below, represented by a negative number, shows weakness, while a break above, represented by a positive percentage, shows strength.
For hundreds of ETF choices, be sure to reference Thursday’s StatSheet.
For this current domestic “Buy” cycle, here’s how some our candidates have fared:

Click image to enlarge.
Again, the %+/-M/A column above shows the position of the various ETFs in relation to their respective long-term trend lines, while the trailing sell stops are being tracked in the “Off High” column. The “Action” column will signal a “Sell” once the -8% point has been taken out in the “Off High” column. For more volatile sector ETFs, the trigger point is -10%.
3. Trend Tracking Indexes (TTIs)
Our TTIs slipped again, with dip buyers being conspicuously absent ahead of the Fed announcement on interest rates.
This is how we closed 12/14/2021:
Domestic TTI: +3.79% above its M/A (prior close +4.42%)—Buy signal effective 07/22/2020.
International TTI: +0.10% above its M/A (prior close +0.27%)—Buy signal effective 07/22/2020.
Disclosure: I am obliged to inform you that I, as well as my advisory clients, own some of the ETFs listed in the above table. Furthermore, they do not represent a specific investment recommendation for you, they merely show which ETFs from the universe I track are falling within the specified guidelines.
All linked charts above are courtesy of Bloomberg via ZeroHedge.
Contact Ulli