
- Moving the markets
The much-anticipated Fed announcement came and went. What mattered most to Wall Street traders was that Powell’s announcement was in line with expectations and contained no surprises.
ZeroHedge clarified it this way:
- The Fed statement and economic projections saw the central bank double the pace of its asset purchase tapering to USD 30bln per month (consisting of USD 20bln Treasuries, USD 10bln MBS – this will be doubled again in January, with similar reductions likely be appropriate each month thereafter), which puts it on course to conclude asset purchases by March, from the prior landing zone of around June, although this could be adjusted if warranted.
- Its updated projections now see three rate hikes in 2022, revising up its view from one hike penciled in at the September FOMC (recall that September, the Committee was essentially split on the potential need for a second 2022 rate hike); longer-term, it has left its terminal rate view unchanged, however.
- Inflation forecasts were revised up to 2.6% for headline PCE by the end of next year (prev. 2.2%), while the core measure is seen at 2.7% by end 2022 (prev. 2.3%).
- On the labor market, the Fed sees the jobless rate return to the 3.5%-mark next year (prev. saw 3.8%), where it is likely to stay over its forecast horizon.
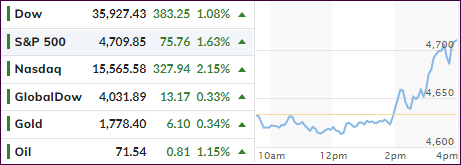
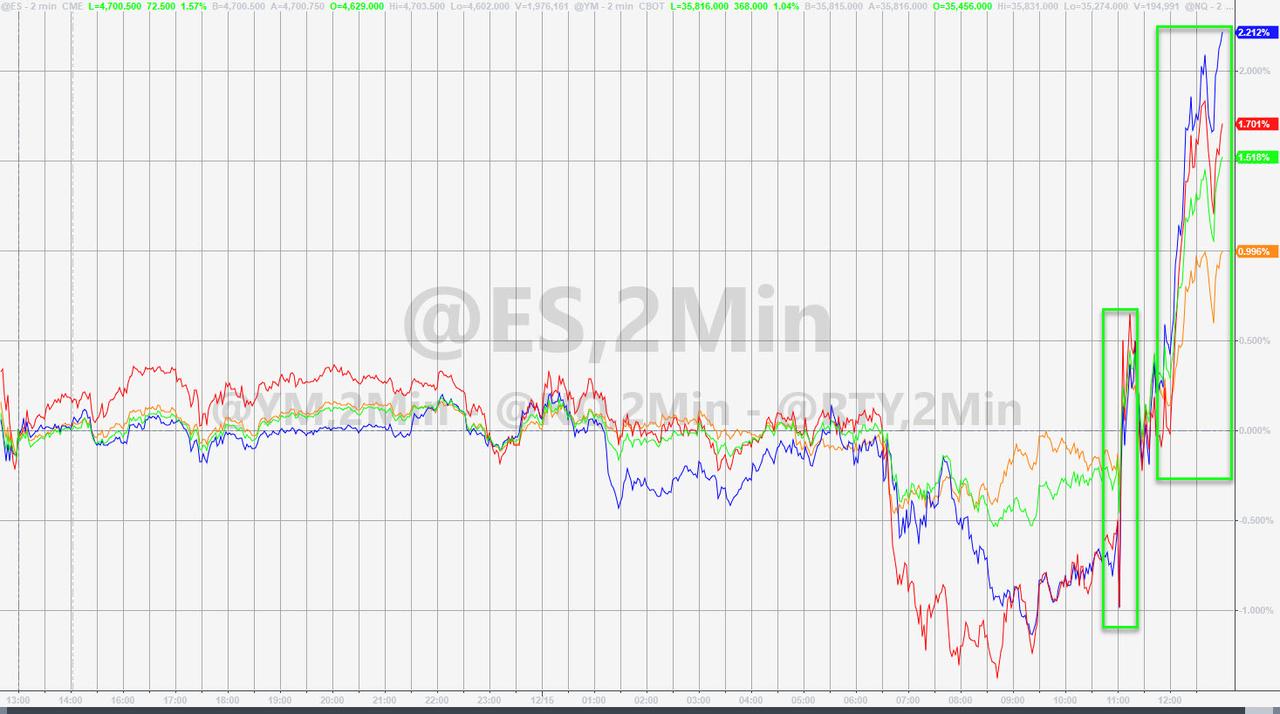
The early slump turned into a giant pump propelling the major indexes out of the doldrums, for sure part of a relief rally, as some analysts had expected a much more aggressive Fed announcement.
Personally, I think that this will still be forthcoming next year when inflation will not be contained as hoped and will be surging much higher.
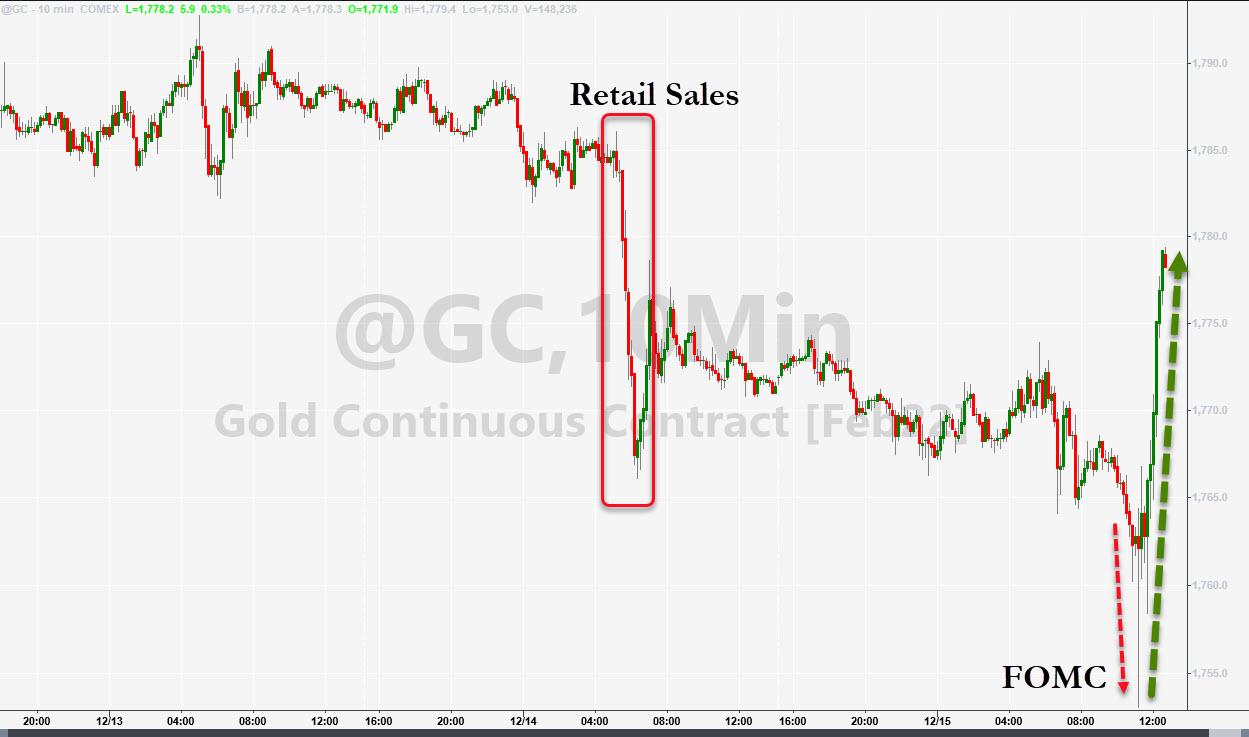
The rebound was broad-based with 9 out of 10 S&P sectors participating, but the US Dollar reversed an early rally and dumped into the close. Gold went the other way by losing momentum early on, after a poor retail sales report, but the precious metal found some footing and ramped higher by 0.38%.
I’ll be out tomorrow but will be writing Friday’s week-ending commentary, with the $4.3 trillion in options expirations surely having an impact on that day’s volatility.
2. ETFs in the Spotlight
In case you missed the announcement and description of this section, you can read it here again.
It features some of the 10 broadly diversified domestic and sector ETFs from my HighVolume list as posted every Saturday. Furthermore, they are screened for the lowest MaxDD% number meaning they have been showing better resistance to temporary sell offs than all others over the past year.
The below table simply demonstrates the magnitude with which these ETFs are fluctuating above or below their respective individual trend lines (%+/-M/A). A break below, represented by a negative number, shows weakness, while a break above, represented by a positive percentage, shows strength.
For hundreds of ETF choices, be sure to reference Thursday’s StatSheet.
For this current domestic “Buy” cycle, here’s how some our candidates have fared:
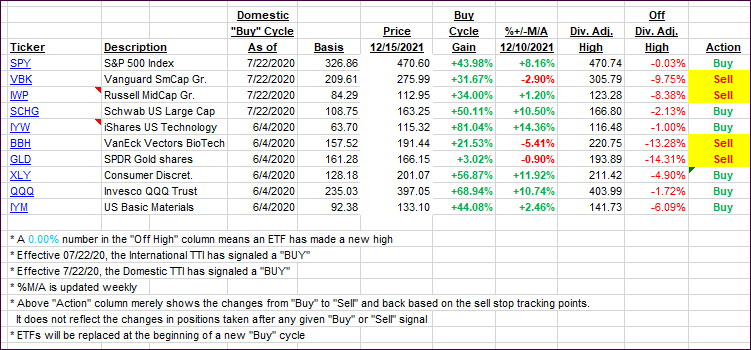
Click image to enlarge.
Again, the %+/-M/A column above shows the position of the various ETFs in relation to their respective long-term trend lines, while the trailing sell stops are being tracked in the “Off High” column. The “Action” column will signal a “Sell” once the -8% point has been taken out in the “Off High” column. For more volatile sector ETFs, the trigger point is -10%.
3. Trend Tracking Indexes (TTIs)
Our TTIs recovered and joined the major indexes in a broad-based rally.
This is how we closed 12/15/2021:
Domestic TTI: +4.93% above its M/A (prior close +3.79%)—Buy signal effective 07/22/2020.
International TTI: +0.59% above its M/A (prior close +0.10%)—Buy signal effective 07/22/2020.
Disclosure: I am obliged to inform you that I, as well as my advisory clients, own some of the ETFs listed in the above table. Furthermore, they do not represent a specific investment recommendation for you, they merely show which ETFs from the universe I track are falling within the specified guidelines.
All linked charts above are courtesy of Bloomberg via ZeroHedge.
Contact Ulli