
- Moving the markets
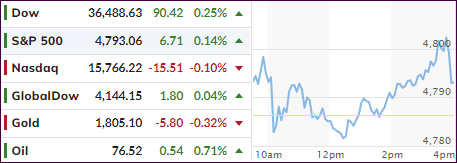
Despite the major indexes bouncing around in a narrow trading range, the S&P 500 managed to notch its 70th record close of the year, while the Dow rose for the 6th day in a row.
Traders hope to not only end the year on a high note but also that this positive momentum will carry at least into the first two trading days into 2022, thereby validating the Santa Claus rally concept.
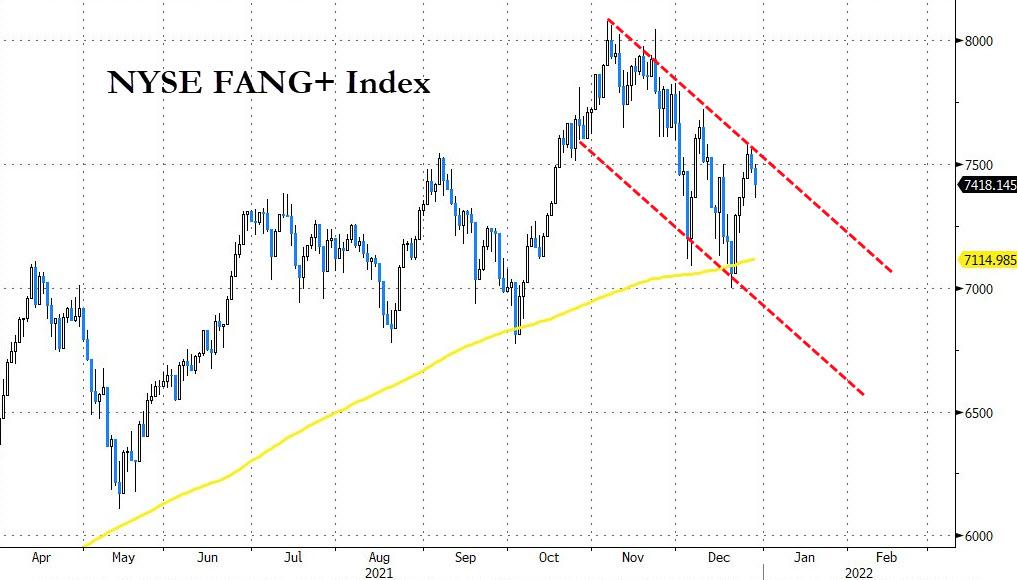
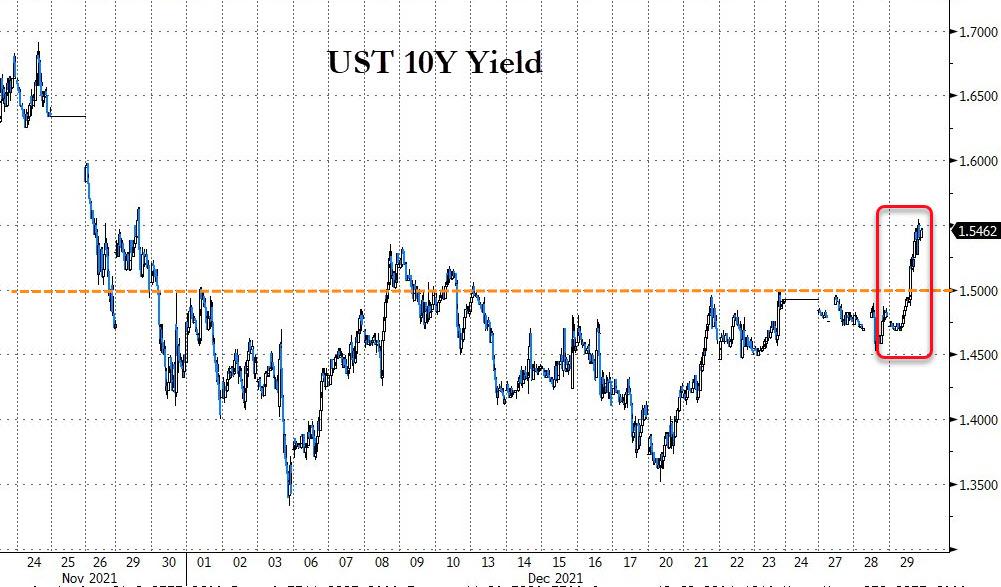
The tech sector struggled today with the Nasdaq closing just about unchanged, as bond yields spiked thus taking the starch out of the “growth” section in general.
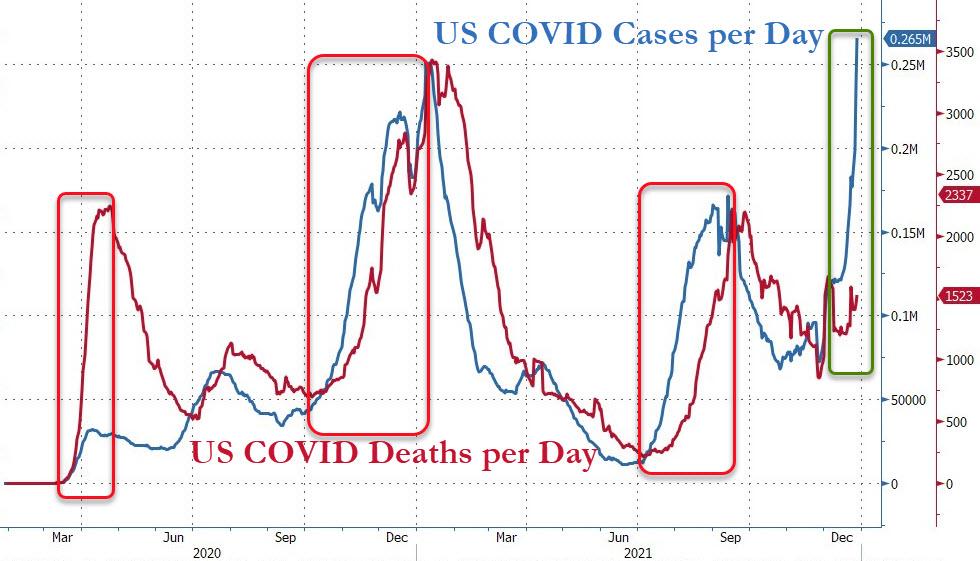
Sentiment continues to weaken, because of potentially tighter monetary policy and the impact of the Omicron variant, the virulency of which remains questionable, as death and hospitalization “refuse” to go along with soaring Covid cases. Hmm…
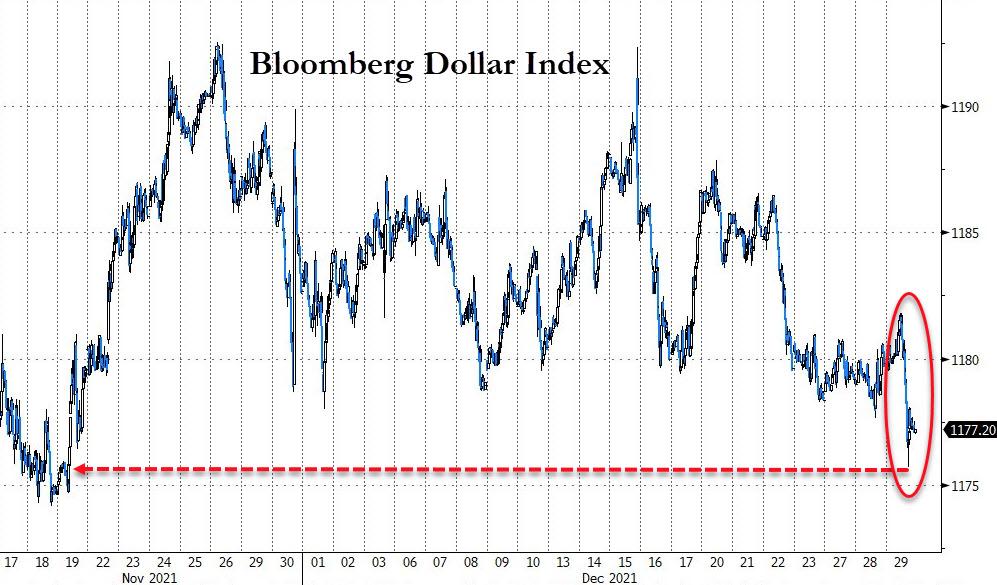
The US Dollar got whacked during this session and plunged to a level last seen just prior to Thanksgiving, while gold dropped and popped and successfully defended its $1,800 level, despite breaking below it midsession.
Economist Nouriel Roubini offered these words of caution:
As long as central banks were in unconventional policy mode, the party could keep going. But the asset and credit bubbles may deflate in 2022 when policy normalization starts. Moreover, inflation, slower growth, and geopolitical and systemic risks could create the conditions for a market correction in 2022. Come what may, investors are likely to remain on the edge of their seats for most of the year.
I will be back to write the final market commentary for 2021 on Friday.
2. ETFs in the Spotlight
In case you missed the announcement and description of this section, you can read it here again.
It features some of the 10 broadly diversified domestic and sector ETFs from my HighVolume list as posted every Saturday. Furthermore, they are screened for the lowest MaxDD% number meaning they have been showing better resistance to temporary sell offs than all others over the past year.
The below table simply demonstrates the magnitude with which these ETFs are fluctuating above or below their respective individual trend lines (%+/-M/A). A break below, represented by a negative number, shows weakness, while a break above, represented by a positive percentage, shows strength.
For hundreds of ETF choices, be sure to reference Thursday’s StatSheet.
For this current domestic “Buy” cycle, here’s how some our candidates have fared:
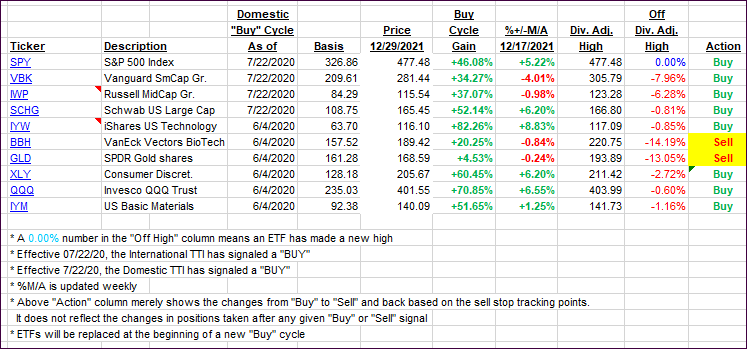
Click image to enlarge.
Again, the %+/-M/A column above shows the position of the various ETFs in relation to their respective long-term trend lines, while the trailing sell stops are being tracked in the “Off High” column. The “Action” column will signal a “Sell” once the -8% point has been taken out in the “Off High” column. For more volatile sector ETFs, the trigger point is -10%.
3. Trend Tracking Indexes (TTIs)
Our TTIs gained a fraction, while the major indexes predominantly trod water.
This is how we closed 12/29/2021:
Domestic TTI: +7.01% above its M/A (prior close +6.70%)—Buy signal effective 07/22/2020.
International TTI: +3.26% above its M/A (prior close 3.25%)—Buy signal effective 07/22/2020.
Disclosure: I am obliged to inform you that I, as well as my advisory clients, own some of the ETFs listed in the above table. Furthermore, they do not represent a specific investment recommendation for you, they merely show which ETFs from the universe I track are falling within the specified guidelines.
All linked charts above are courtesy of Bloomberg via ZeroHedge.
Contact Ulli