
- Moving the markets
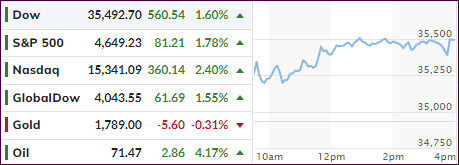
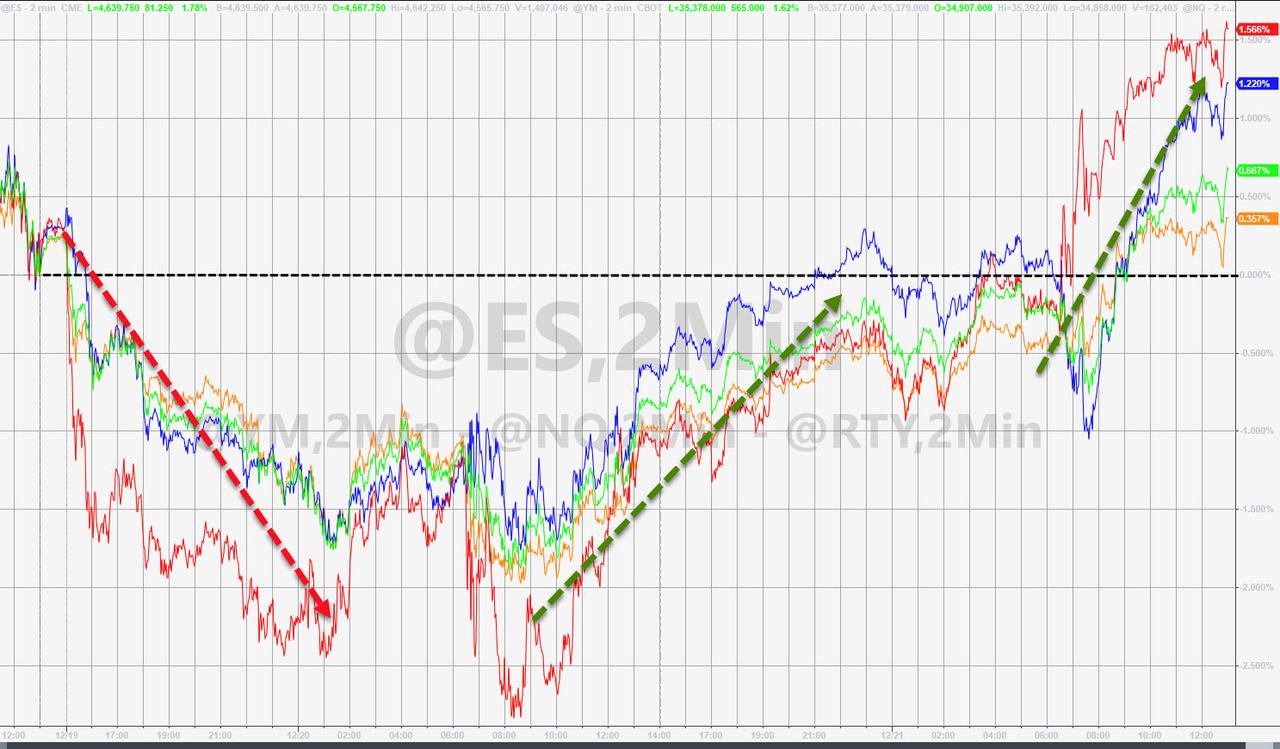
The futures markets already indicated last night that green numbers might appear during today’s day session. That’s exactly how it turned out with the Dow sprinting ahead by some 300 points, a lead that slowly and steadily grew larger as the day progressed.
The other two major indexes joined the party with the Nasdaq taking the lead and sporting a gain of 2.40% at the close. With that much upward momentum, I did not execute the planned sale of the one ETF that had penetrated its trailing sell stop, because it thrust higher by over 2.5%.
Today’s rebound was a nice beginning after a 3-day losing streak, which is now in the rearview mirror. Traders finally caught on to the fact that the omicron variant may be highly infectious but induced illnesses remain mild. Hmm, makes me wonder if the arrival of the flu season has something to do with it?
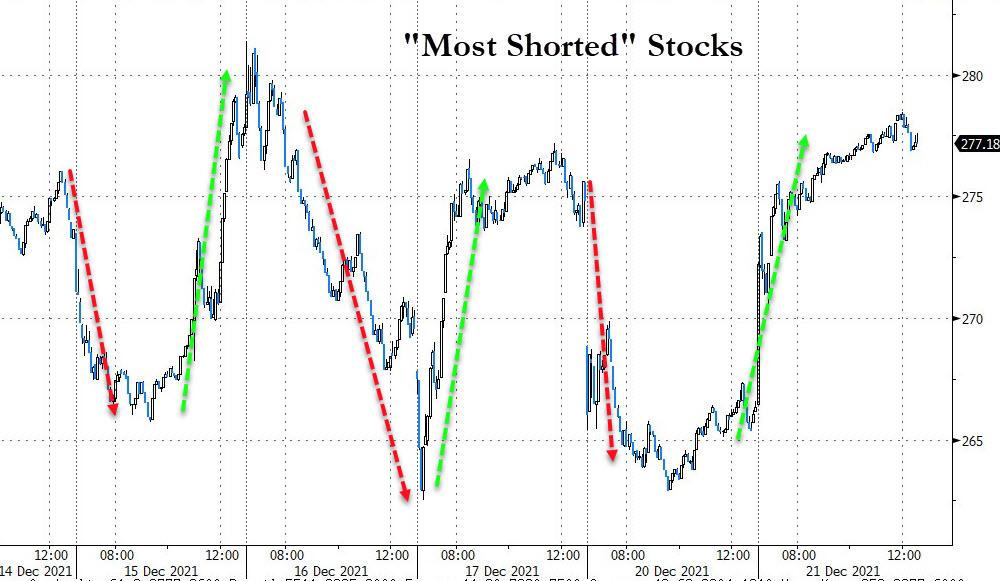
Today, the short squeeze was back in “on-mode”, as apparently someone must have had fun by pushing the on/off switch over the last week, as Bloomberg/ZeroHedge point to in this chart.
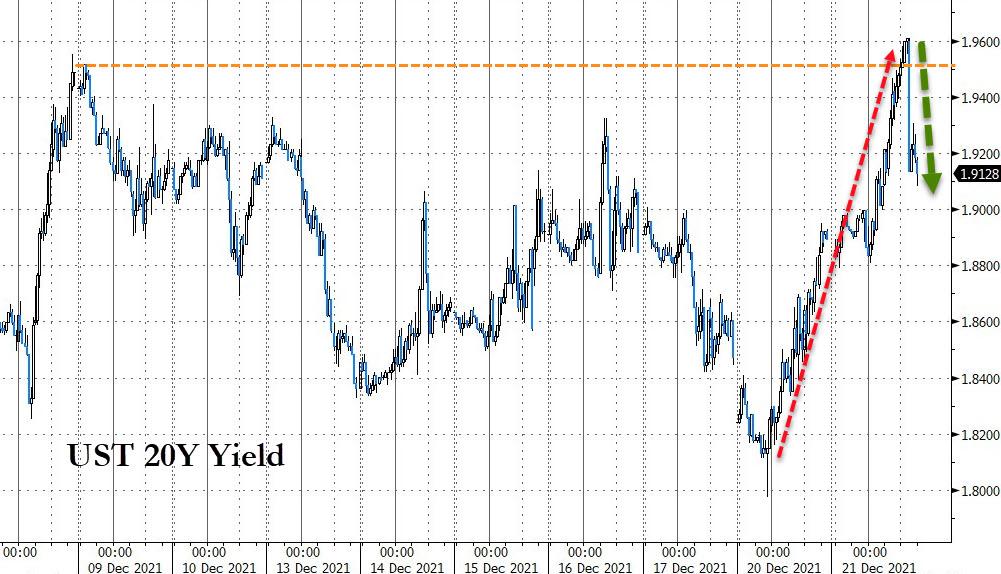
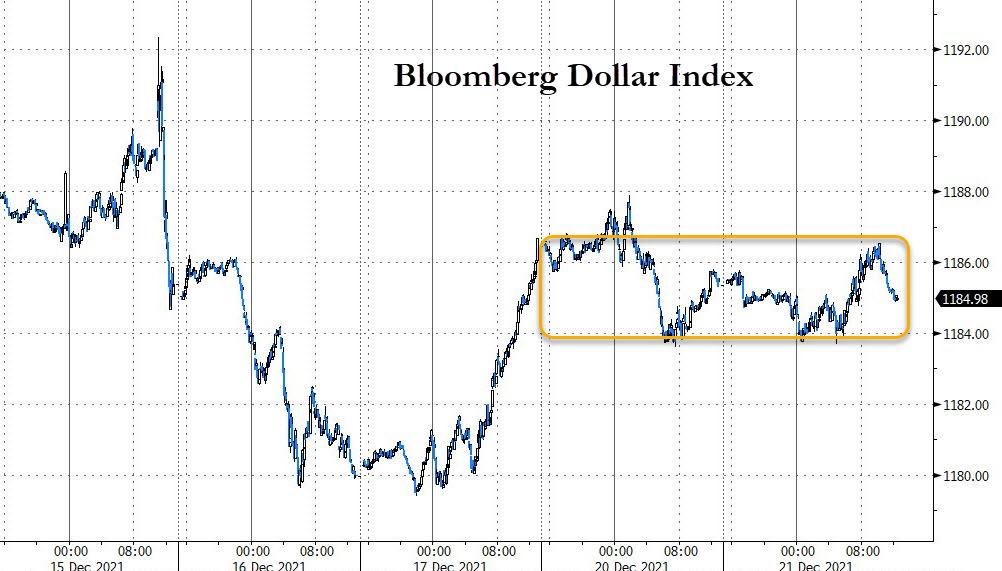
Bond yields popped with especially the 20-year demonstrating a wild ride, most likely due its auction today, while the 10-year was far more stable. The US Dollar bounced around but remained in his trading range of the past couple of days and held tight to its unchanged line.
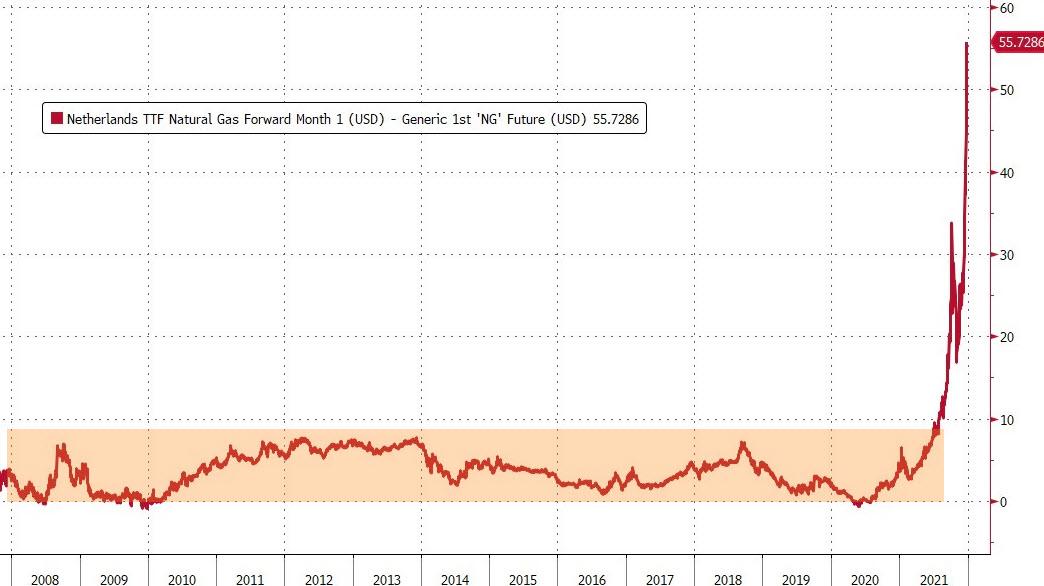
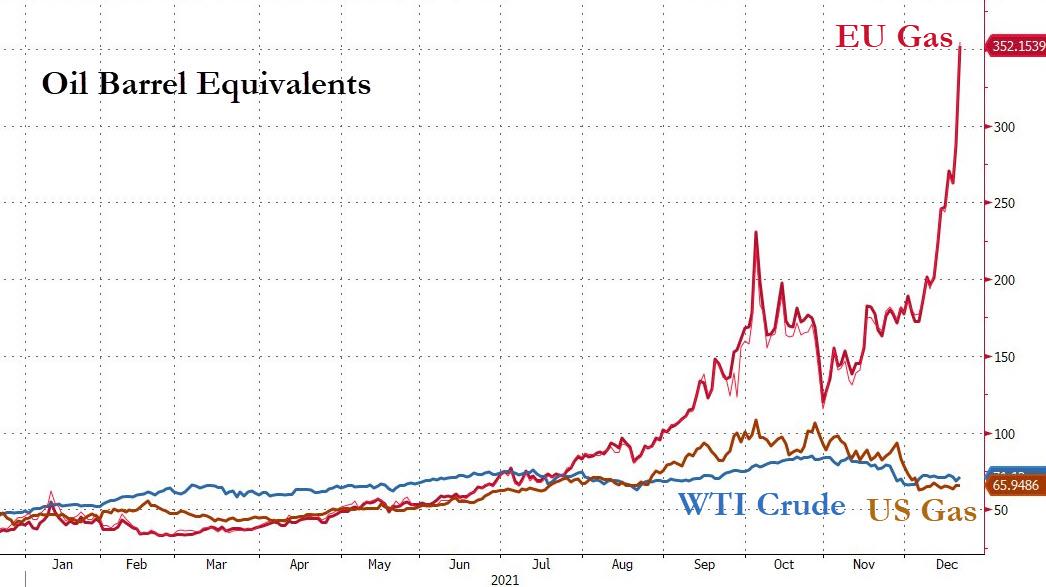
Europeans (EU) are facing a very cold winter in more ways than one. Their natural gas prices exploded to record highs today. To put this spike in context, ZeroHedge posted this chart from Bloomberg showing that the EU gas trades at an oil barrel equivalent of over $350!! Ouch.
Could you imagine what life with $350/barrel of oil would be like?
I won’t have a chance to write tomorrow’s report, but I will be back on Thursday to post the weekending version.
2. ETFs in the Spotlight
In case you missed the announcement and description of this section, you can read it here again.
It features some of the 10 broadly diversified domestic and sector ETFs from my HighVolume list as posted every Saturday. Furthermore, they are screened for the lowest MaxDD% number meaning they have been showing better resistance to temporary sell offs than all others over the past year.
The below table simply demonstrates the magnitude with which these ETFs are fluctuating above or below their respective individual trend lines (%+/-M/A). A break below, represented by a negative number, shows weakness, while a break above, represented by a positive percentage, shows strength.
For hundreds of ETF choices, be sure to reference Thursday’s StatSheet.
For this current domestic “Buy” cycle, here’s how some our candidates have fared:
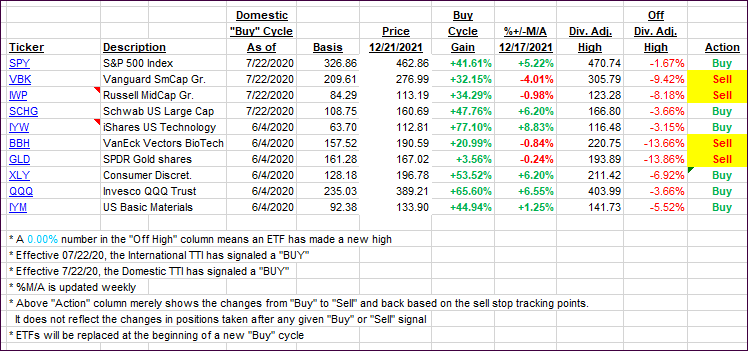
Click image to enlarge.
Again, the %+/-M/A column above shows the position of the various ETFs in relation to their respective long-term trend lines, while the trailing sell stops are being tracked in the “Off High” column. The “Action” column will signal a “Sell” once the -8% point has been taken out in the “Off High” column. For more volatile sector ETFs, the trigger point is -10%.
3. Trend Tracking Indexes (TTIs)
Our TTIs recovered, because a broad market rally pulled the major indexes out of the doldrums, including our International TTI, which moved back above its trendline.
This is how we closed 12/21/2021:
Domestic TTI: +3.73% above its M/A (prior close +1.69%)—Buy signal effective 07/22/2020.
International TTI: +0.75% above its M/A (prior close -0.83%)—Buy signal effective 07/22/2020.
Disclosure: I am obliged to inform you that I, as well as my advisory clients, own some of the ETFs listed in the above table. Furthermore, they do not represent a specific investment recommendation for you, they merely show which ETFs from the universe I track are falling within the specified guidelines.
All linked charts above are courtesy of Bloomberg via ZeroHedge.
Contact Ulli