
- Moving the markets
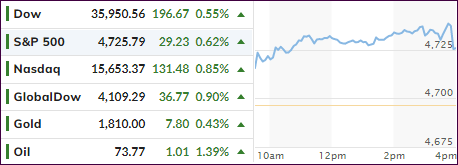
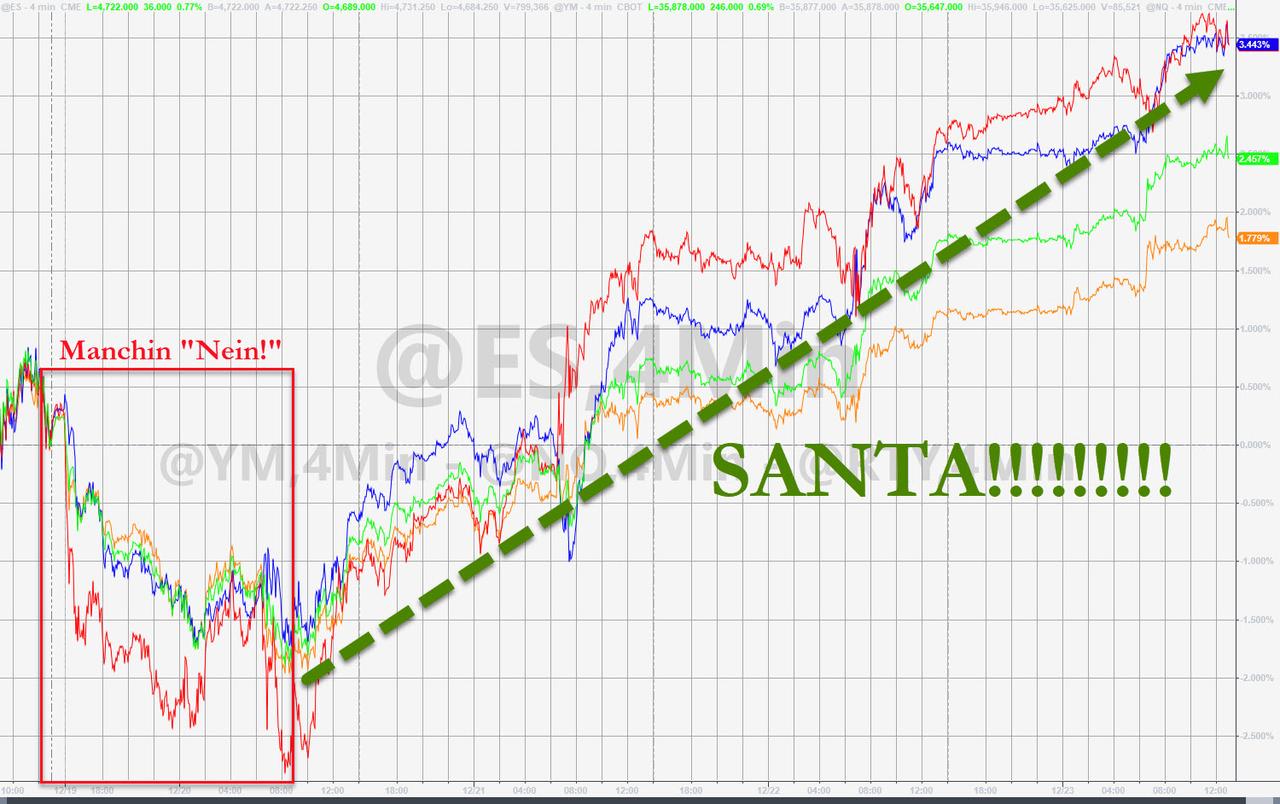
Optimism, that global economies may not become derailed as feared, contributed to the major indexes not only stringing together a 3-day win streak but also the S&P 500 scoring another record close.
The gains were broad with value, growth (tech) and SmallCaps all participating with similar advances. The only fly in the ointment was that volume was low due to the upcoming Christmas weekend and tomorrow only featuring a shortened trading session.
Explained Jim Paulson of the Leuthold Group:
“Much of the stock market’s rally this week is due to overdone fears last week and a palpable sigh of relief the selling finally stopped. Once the market turned higher, dip-buyers not wanting to miss out on a Santa Rally have taken charge.”
Despite worsening inflation, some of the economic data did not show any outliers. New home sales jumped despite massive October downward revisions, initial jobless claims are bouncing around at pre-Covid lockdown levels, while personal income and spending showed increases in November.
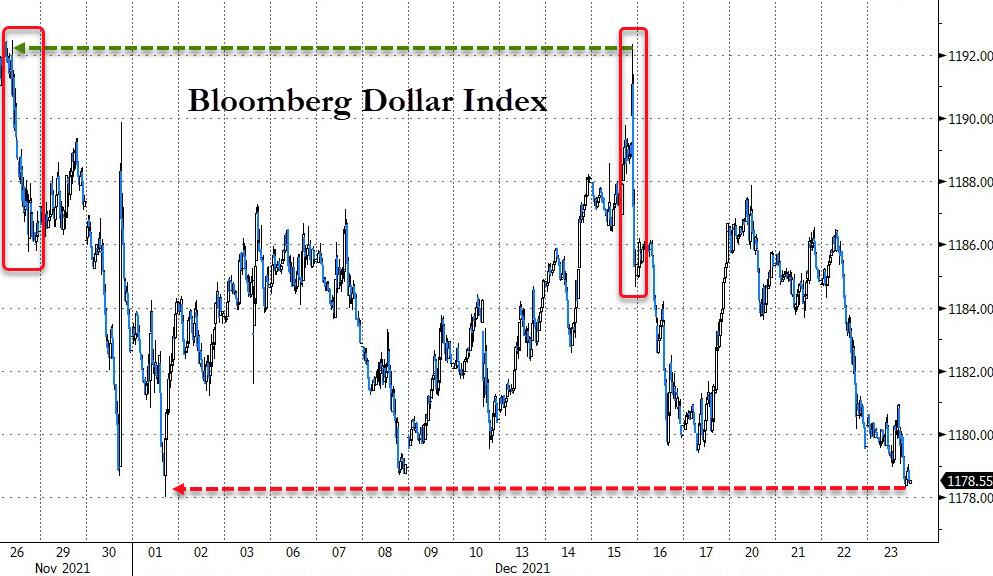
Even though stocks have rallied sharply, long bond yields have not been keeping up and have not been able to take out their “omicron” highs, as ZeroHedge pointed out in this chart. The US Dollar, while attempting a breakout, fell short as well and stair stepped to its lowest level since the beginning of this month.
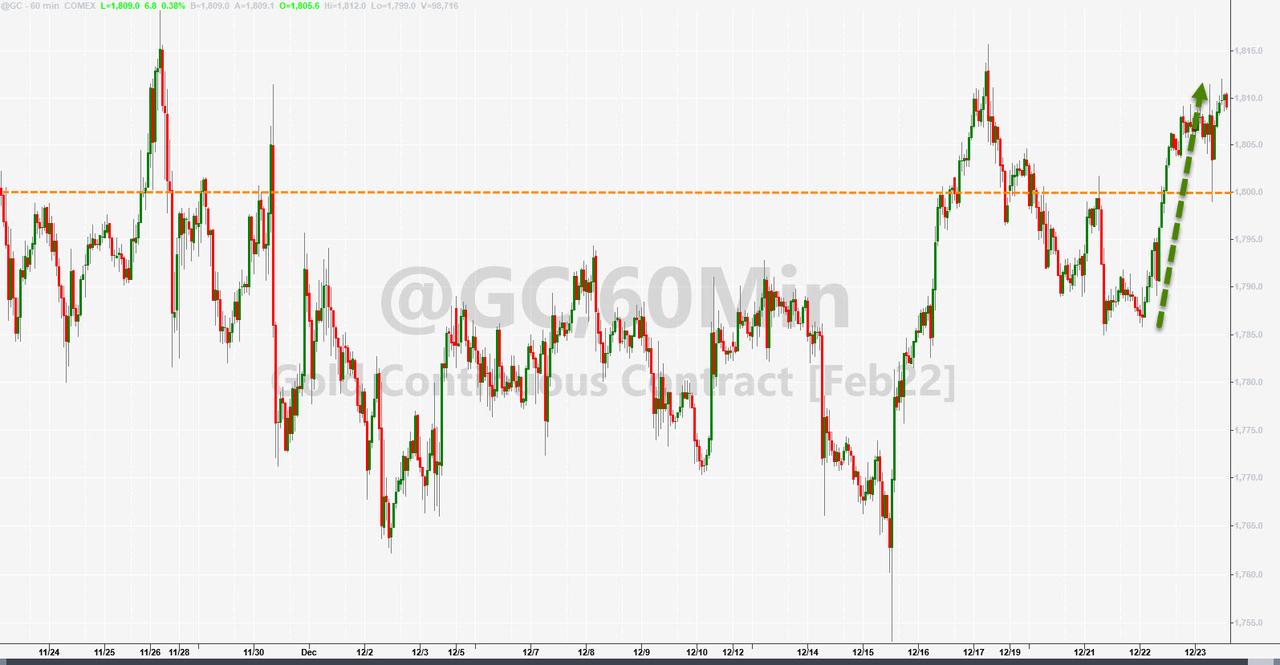
Gold recovered from its recent pullback and finally managed to break above its $1,800 level after gaining 0.94% yesterday and 0.43% today.
I will post the weekly StatSheet tonight but will not report on tomorrow’s shortened session. I’ll be back for Monday’s commentary.
Merry Christmas!
2. ETFs in the Spotlight
In case you missed the announcement and description of this section, you can read it here again.
It features some of the 10 broadly diversified domestic and sector ETFs from my HighVolume list as posted every Saturday. Furthermore, they are screened for the lowest MaxDD% number meaning they have been showing better resistance to temporary sell offs than all others over the past year.
The below table simply demonstrates the magnitude with which these ETFs are fluctuating above or below their respective individual trend lines (%+/-M/A). A break below, represented by a negative number, shows weakness, while a break above, represented by a positive percentage, shows strength.
For hundreds of ETF choices, be sure to reference Thursday’s StatSheet.
For this current domestic “Buy” cycle, here’s how some our candidates have fared:
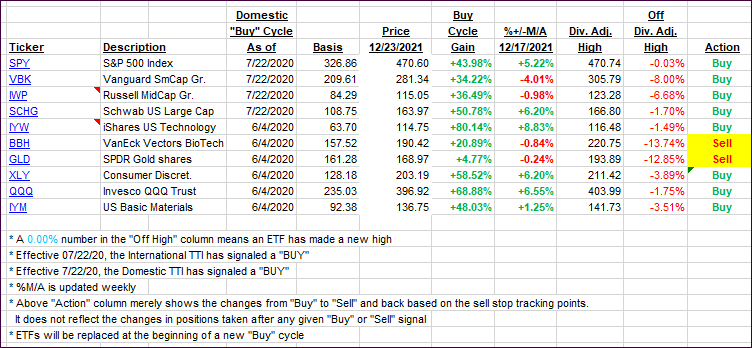
Click image to enlarge.
Again, the %+/-M/A column above shows the position of the various ETFs in relation to their respective long-term trend lines, while the trailing sell stops are being tracked in the “Off High” column. The “Action” column will signal a “Sell” once the -8% point has been taken out in the “Off High” column. For more volatile sector ETFs, the trigger point is -10%.
3. Trend Tracking Indexes (TTIs)
Our TTIs followed the bullish theme and moved further away from a potential trend line break.
This is how we closed 12/23/2021:
Domestic TTI: +5.19% above its M/A (prior close +4.48%)—Buy signal effective 07/22/2020.
International TTI: +2.38% above its M/A (prior close 1.56%)—Buy signal effective 07/22/2020.
Disclosure: I am obliged to inform you that I, as well as my advisory clients, own some of the ETFs listed in the above table. Furthermore, they do not represent a specific investment recommendation for you, they merely show which ETFs from the universe I track are falling within the specified guidelines.
All linked charts above are courtesy of Bloomberg via ZeroHedge.
Contact Ulli