
- Moving the markets
My somewhat humorous headline contains some truth in that hope for a Santa Claus rally is alive and well but has been met with resistance due to intensifying omicron fears with a resurgence in the number of Covid cases, which have been blamed on the variant.
To be clear, the Santa Claus rally may still materialize, as “Stock Trader’s Almanac” considers it to be the period including the last five trading days of the year and the first two trading days of January. That means, all hope is not yet lost.
Today was simply a continuation of Friday’s slam with dip buyers again being conspicuously absent. Commented Jim Paulsen of the Leuthold Group:
The downward move in markets “reflecting growing uncertainty surrounding whether the Omicron surge will bring new widespread economic shutdowns, an unexpected shelving of additional fiscal stimulus from President Biden’s Build Back Better plan, and a breach by the S&P 500 index of its 50-day moving average.”
Today, there was no place to hide, because growth, value and SmallCaps were equally hammered, as was the tech sector in general. Even the low volatility SPLV ETF was not able to withstand the selling and gave back -0.31%.
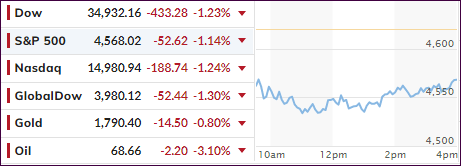
The major indexes swooned in unison and bounded off their worst levels of the session, but it was not nearly enough to even think about a green close. Interestingly, the S&P 500 closed today within 1 point of where it started the month of December, so not much has been gained or lost during this period, despite the index having just suffered its biggest 3-day drop since May.
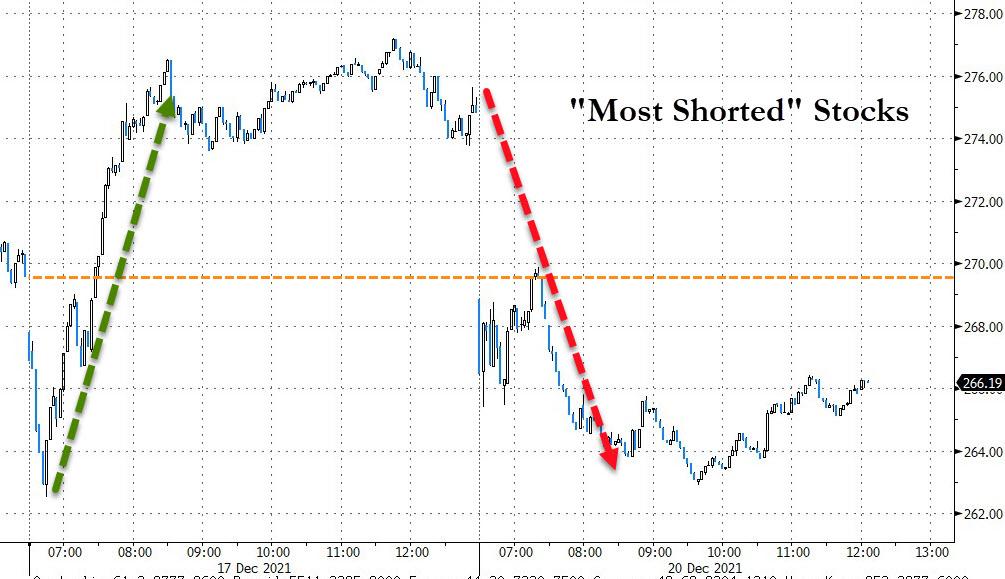
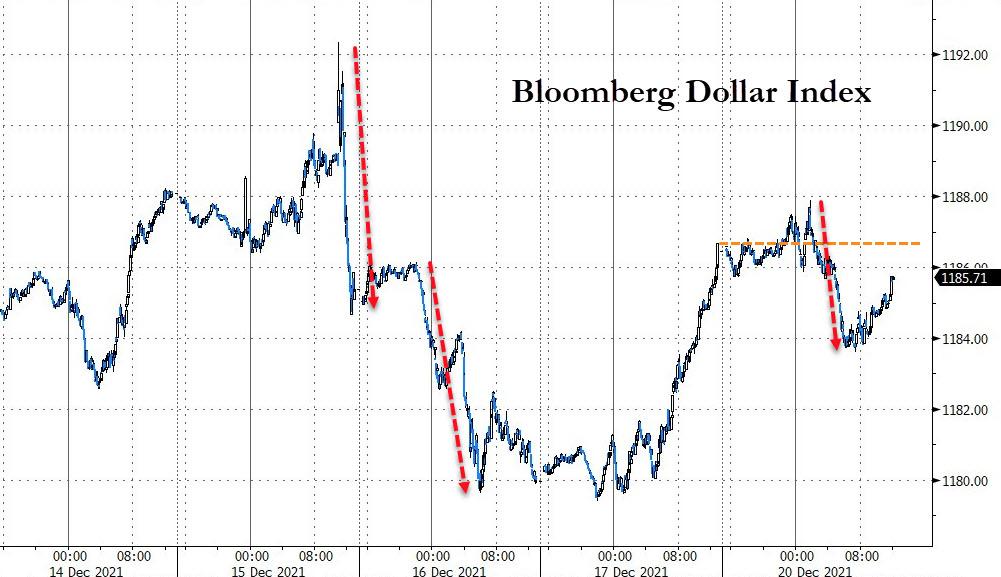
The most shorted stocks surrendered Friday’s victory, as ZeroHedge pointed out, while the US Dollar was not able to build on its recent gains and ended up bouncing lower. Gold held steady for most of the morning, that is until the bears put another nail in the coffin and sent the precious metal down -0.81%.
2. ETFs in the Spotlight
In case you missed the announcement and description of this section, you can read it here again.
It features some of the 10 broadly diversified domestic and sector ETFs from my HighVolume list as posted every Saturday. Furthermore, they are screened for the lowest MaxDD% number meaning they have been showing better resistance to temporary sell offs than all others over the past year.
The below table simply demonstrates the magnitude with which these ETFs are fluctuating above or below their respective individual trend lines (%+/-M/A). A break below, represented by a negative number, shows weakness, while a break above, represented by a positive percentage, shows strength.
For hundreds of ETF choices, be sure to reference Thursday’s StatSheet.
For this current domestic “Buy” cycle, here’s how some our candidates have fared:
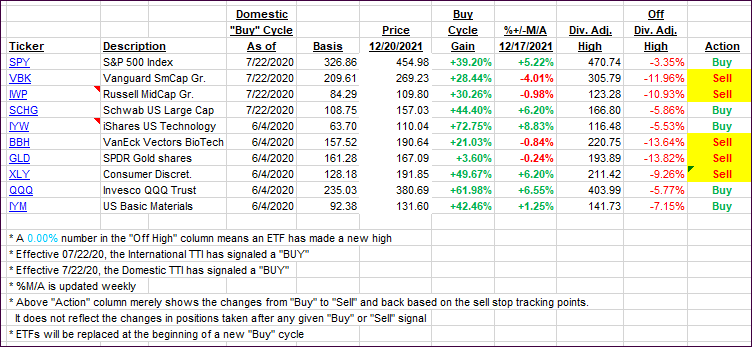
Click image to enlarge.
Again, the %+/-M/A column above shows the position of the various ETFs in relation to their respective long-term trend lines, while the trailing sell stops are being tracked in the “Off High” column. The “Action” column will signal a “Sell” once the -8% point has been taken out in the “Off High” column. For more volatile sector ETFs, the trigger point is -10%.
3. Trend Tracking Indexes (TTIs)
Our TTIs dumped, as the markets followed their path of least resistance. The International TTI again crossed its trend line to the downside but only by small margin. I will want to see more staying power “below” before considering that Buy cycle to be over. As posted before, in my advisor practice, we are not exposed to the international sector, so this has no effect on our holdings.
The Domestic TTI is also signaling a potential break of its respective trend line to the downside, but we are not quite there yet. However, one of our more volatile holdings has triggered its trailing sell stop and will be liquidated tomorrow, unless a rebound rally emerges.
This is how we closed 12/20/2021:
Domestic TTI: +1.69% above its M/A (prior close +3.04%)—Buy signal effective 07/22/2020.
International TTI: -0.83% below its M/A (prior close +0.36%)—Buy signal effective 07/22/2020.
Disclosure: I am obliged to inform you that I, as well as my advisory clients, own some of the ETFs listed in the above table. Furthermore, they do not represent a specific investment recommendation for you, they merely show which ETFs from the universe I track are falling within the specified guidelines.
All linked charts above are courtesy of Bloomberg via ZeroHedge.
Contact Ulli