
- Moving the markets
Overnight, Chinese econ data came in far below expectations thereby pulling down the futures markets. Even though their retail sales increased by 8.5% in July, it was a far cry from the expected 11.5% forecast. The manufacturing sector figure disappointed as well.
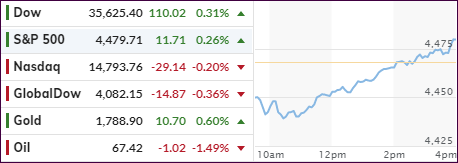
This negative sentiment carried over into the regular session with the Dow sinking some 200 points with the other major indexes showing similar losses. Not helping the mood initially was the Fed with their statement that they will announce “a tapering of its bond purchases in September,” which then would be implemented within a month or so thereafter.
Still, traders opined that “fundamentals” still support the “risk on” meme, and a slow and steady recovery pulled the indexes out of an early hole with only the Nasdaq failing to close in the green. Helping the retail sector climb higher were positive prospects of quarterly earnings reports from the big players like Home Depot and Walmart.
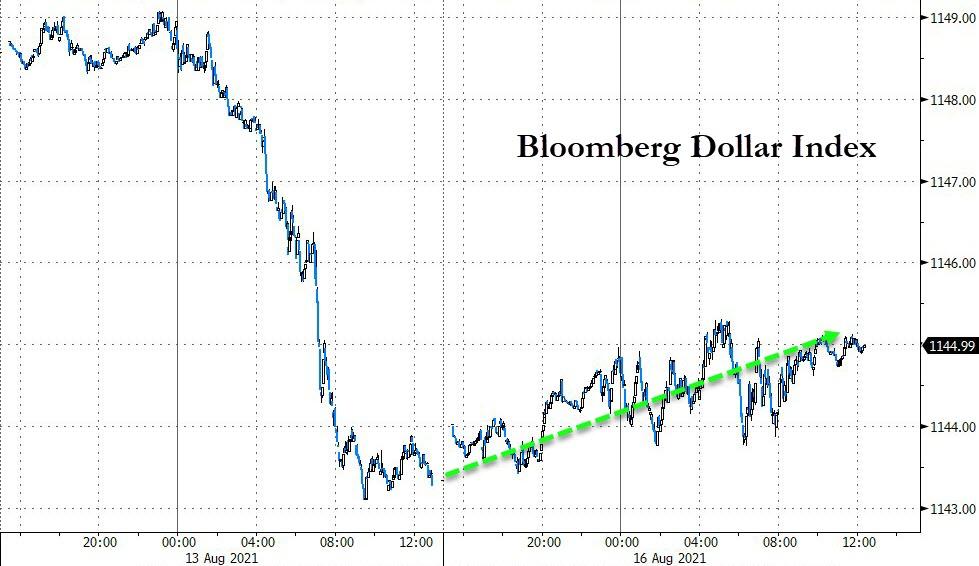
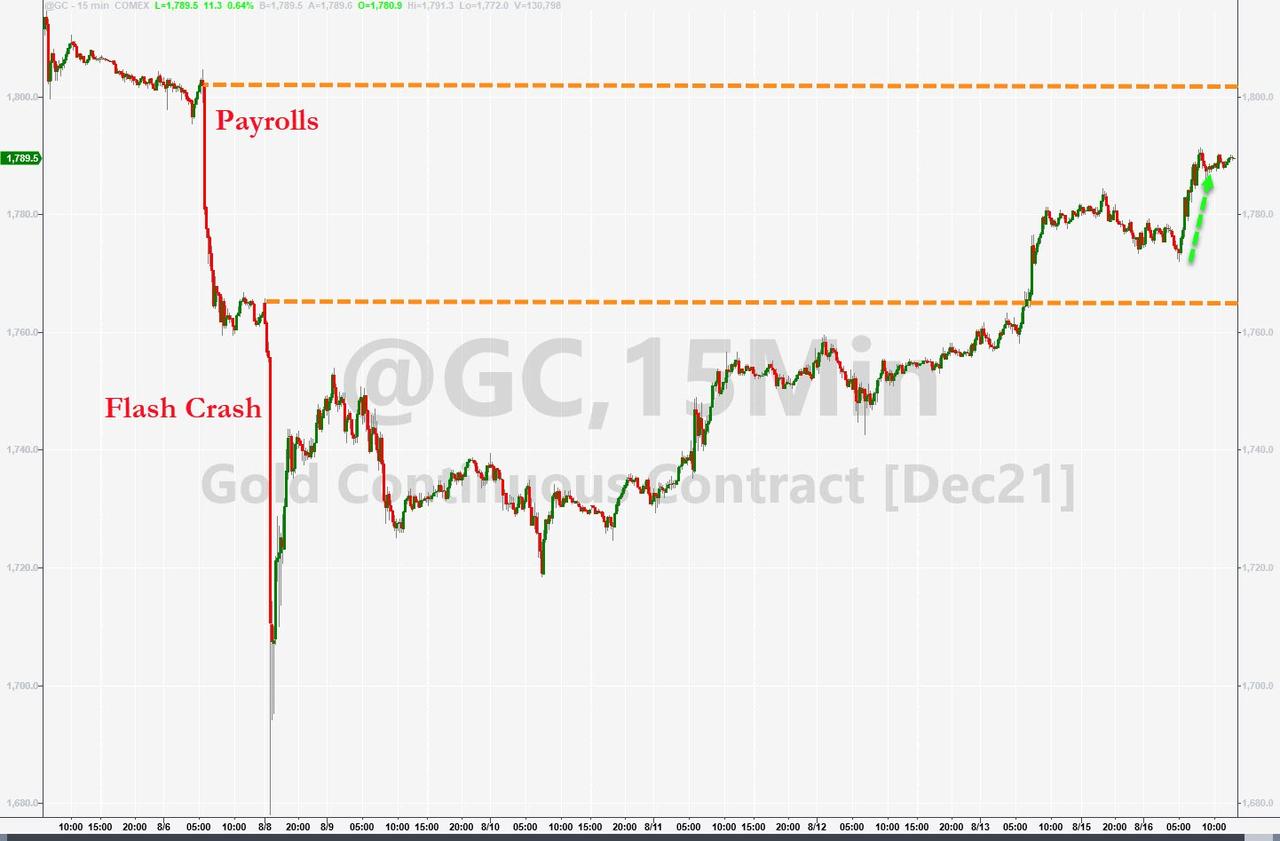
The US Dollar inched higher, while bond yields slipped a tad. Gold was the beneficiary of today’s uncertainty, and the precious metal added 0.62% but stopped short of its $1,800 level.
Bloomberg reported that August is shaping up to be one of the calmest on record. The equity benchmark has fluctuated an average 0.5% each day, a level of tranquility that, except for 2017, has rarely happened. Makes me go “Hmmm.”
My posting schedule for this week looks like this.
2. ETFs in the Spotlight
In case you missed the announcement and description of this section, you can read it here again.
It features some of the 10 broadly diversified domestic and sector ETFs from my HighVolume list as posted every Saturday. Furthermore, they are screened for the lowest MaxDD% number meaning they have been showing better resistance to temporary sell offs than all others over the past year.
The below table simply demonstrates the magnitude with which these ETFs are fluctuating above or below their respective individual trend lines (%+/-M/A). A break below, represented by a negative number, shows weakness, while a break above, represented by a positive percentage, shows strength.
For hundreds of ETF choices, be sure to reference Thursday’s StatSheet.
For this current domestic “Buy” cycle, here’s how some our candidates have fared:
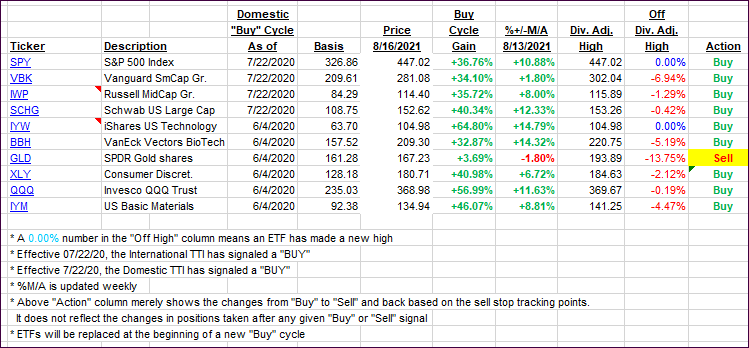
Click image to enlarge.
Again, the %+/-M/A column above shows the position of the various ETFs in relation to their respective long-term trend lines, while the trailing sell stops are being tracked in the “Off High” column. The “Action” column will signal a “Sell” once the -8% point has been taken out in the “Off High” column. For more volatile sector ETFs, the trigger point is -10%.
3. Trend Tracking Indexes (TTIs)
Our TTIs were mixed and barely changed.
This is how we closed 08/16/2021:
Domestic TTI: +10.65% above its M/A (prior close +10.61%)—Buy signal effective 07/22/2020.
International TTI: +7.43+% above its M/A (prior close +7.87%)—Buy signals effective 07/22/2020.
Disclosure: I am obliged to inform you that I, as well as my advisory clients, own some of the ETFs listed in the above table. Furthermore, they do not represent a specific investment recommendation for you, they merely show which ETFs from the universe I track are falling within the specified guidelines.
All linked charts above are courtesy of Bloomberg via ZeroHedge.
Contact Ulli