
- Moving the markets
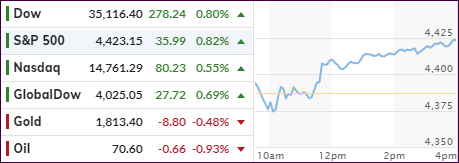
A sloppy opening and quick pullback put the major indexes on the defensive with all three of them sinking into the red. It was a reversal from yesterday’s action when an early pump turned into a late dump.
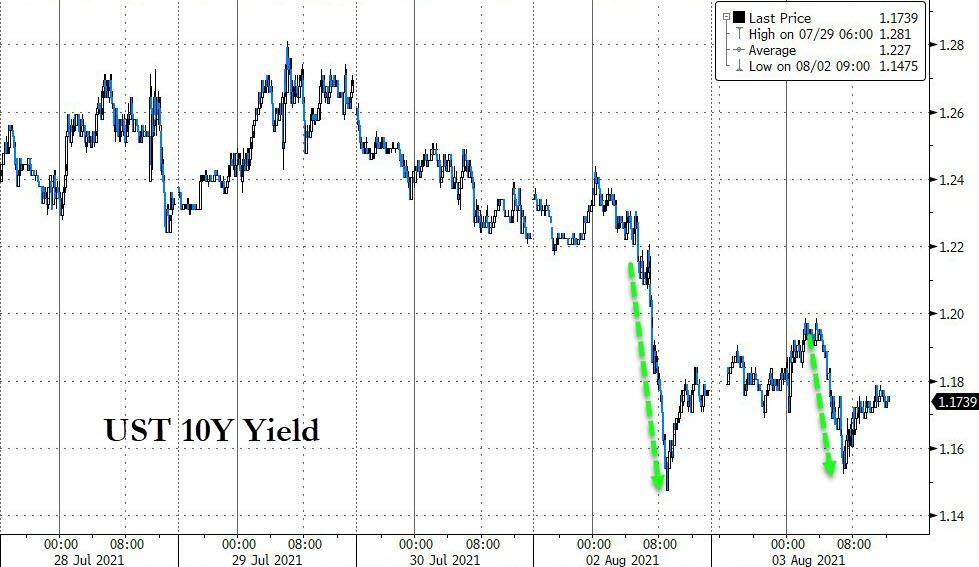
Bond yields proved to be the stabilizing factor with 10-year yields rebounding from Monday’s drop to nearly five-month lows, which was repeated early this morning, and giving stocks a good enough reason to follow suit. Remember, that sliding bond yields indicate economic weakness, while rising ones, within reason, account for economic expansion.
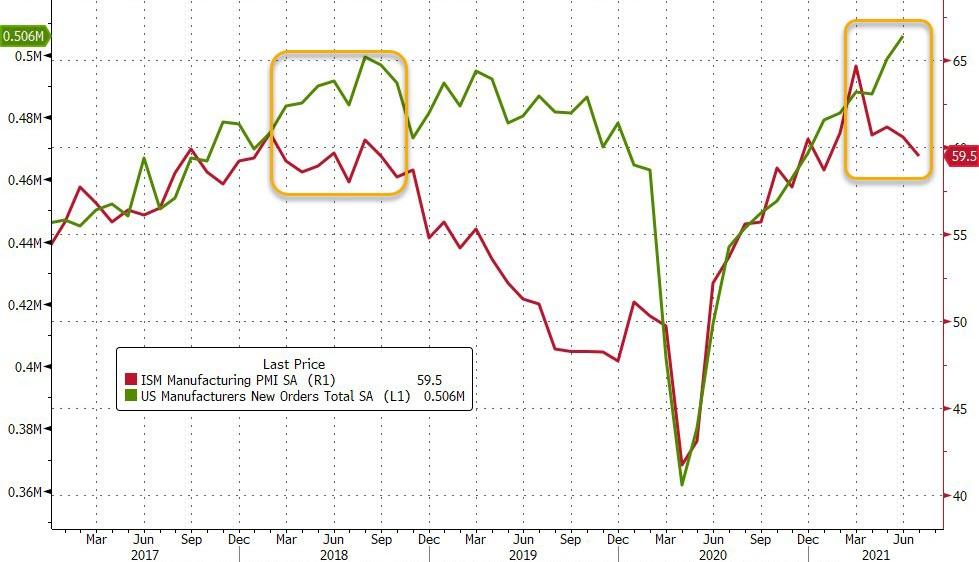
Factory orders printed better-than-expected and lent support to the theme that the economy is still in expansion mode, at least for this day. Lately, econ reports paint at best a mixed picture, which is why we are seeing some of these extreme moves in the markets.
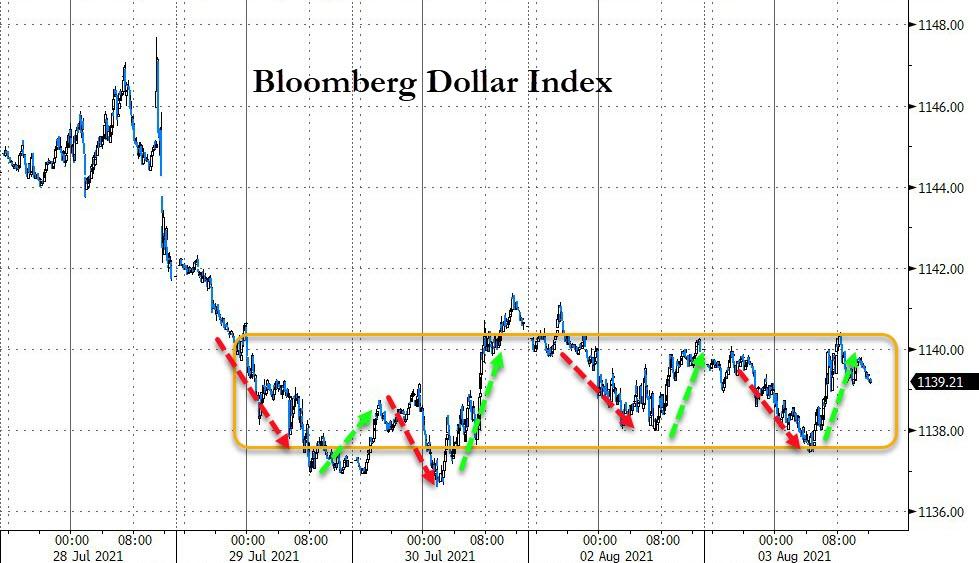
The US Dollar bounced off its lows and, together with rising bond yields, kept gold in check with the precious metal ETF GLD closing just about unchanged.
The ongoing battle between Small Caps (VBK) and “value” (RPV) was clearly won by the latter with a solid gain of +1.37%, while the former barely stayed in the green.
August started the month with two opposite trading days and increased volatility, as the latest headline news continues to be the dominating factor for market direction.
2. ETFs in the Spotlight
In case you missed the announcement and description of this section, you can read it here again.
It features some of the 10 broadly diversified domestic and sector ETFs from my HighVolume list as posted every Saturday. Furthermore, they are screened for the lowest MaxDD% number meaning they have been showing better resistance to temporary sell offs than all others over the past year.
The below table simply demonstrates the magnitude with which these ETFs are fluctuating above or below their respective individual trend lines (%+/-M/A). A break below, represented by a negative number, shows weakness, while a break above, represented by a positive percentage, shows strength.
For hundreds of ETF choices, be sure to reference Thursday’s StatSheet.
For this current domestic “Buy” cycle, here’s how some our candidates have fared:
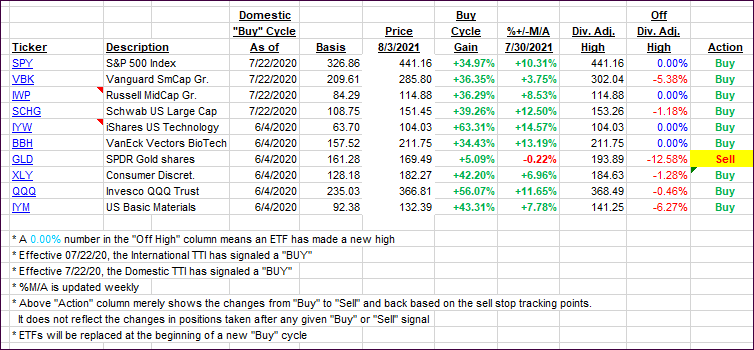
Click image to enlarge.
Again, the %+/-M/A column above shows the position of the various ETFs in relation to their respective long-term trend lines, while the trailing sell stops are being tracked in the “Off High” column. The “Action” column will signal a “Sell” once the -8% point has been taken out in the “Off High” column. For more volatile sector ETFs, the trigger point is -10%.
3. Trend Tracking Indexes (TTIs)
Our TTIs rebounded with a vengeance, as the markets roared back out of an early hole.
This is how we closed 08/03/2021:
Domestic TTI: +11.06% above its M/A (prior close +10.14%)—Buy signal effective 07/22/2020.
International TTI: +7.24% above its M/A (prior close +6.44%)—Buy signals effective 07/22/2020.
Disclosure: I am obliged to inform you that I, as well as my advisory clients, own some of the ETFs listed in the above table. Furthermore, they do not represent a specific investment recommendation for you, they merely show which ETFs from the universe I track are falling within the specified guidelines.
All linked charts above are courtesy of Bloomberg via ZeroHedge.
Contact Ulli