
ETF Tracker StatSheet
You can view the latest version here.
THE FED HANGOVER CONTINUES
- Moving the markets
The fact that the Fed’s announcement of higher rates possibly in 2023, some 2 years from now, caused such a disturbance in the financial markets, goes to clearly confirm the one thing I have been pounding on for years. Namely, that without artificially low interest rates and reckless bond buying by the Fed at the tune of $120 billion per month, stocks would be at a much lower level and are only hovering in bubble territory because of the Fed’s largesse, aka manipulation.
After all, how else can you explain this current fallout based only on the possibility of higher rates two years from now?
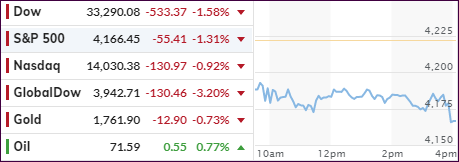
Be that as it may, today’s quadruple options expiration session greatly contributed to increased volatility with all major indexes hitting the skids, but it could have been far worse than the S&P 500’s 3.5% drop for the week.
To some investors, this pullback appears to be a big deal, but only because we have not seen these kinds of fluctuations since January, as market instability has been “well managed” over the past few months.
Not helping the sour mood on Wall Street was the Fed’s mouthpiece Jim Bullard, who told CNBC:
It was natural for the Fed to tilt a little “hawkish” this week and that the first rate increase from the central bank would likely come in 2022.
That was a change from the original forecast of two hikes in 2023, but who knows how much the narrative will change as time goes on. For right now, the Fed threw down the gauntlet, and the markets reacted.
There was no escape as even energy, industrials, financials, and materials took a licking. The yield curve drastically flattened, which means that shorter term Treasuries, like the 2-year note, rose, while longer-term durations, like the 10-year bond, declined.
Elaborated CNBC:
The retreat in long-dated bond yields reflects less optimism toward economic growth, while the jump in short-end yields shows the expectations of the Fed raising rates.
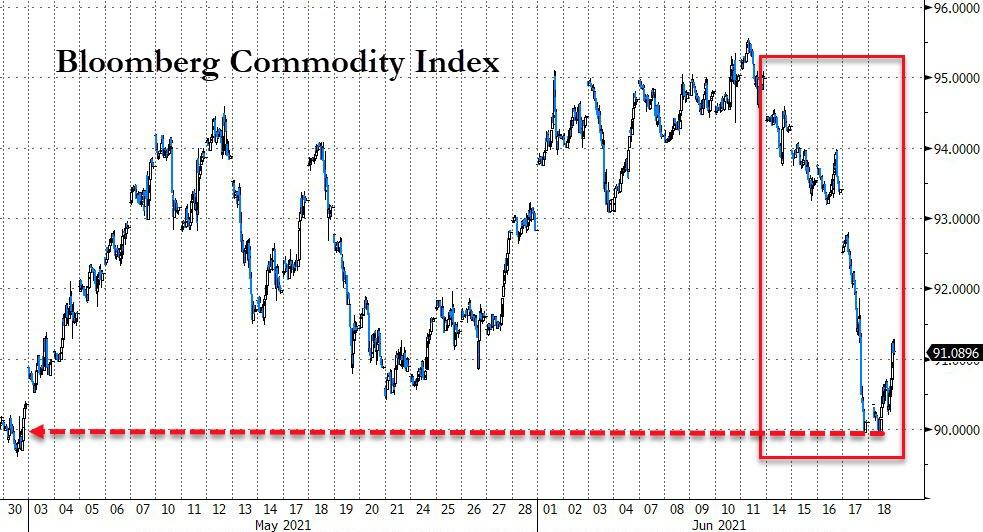
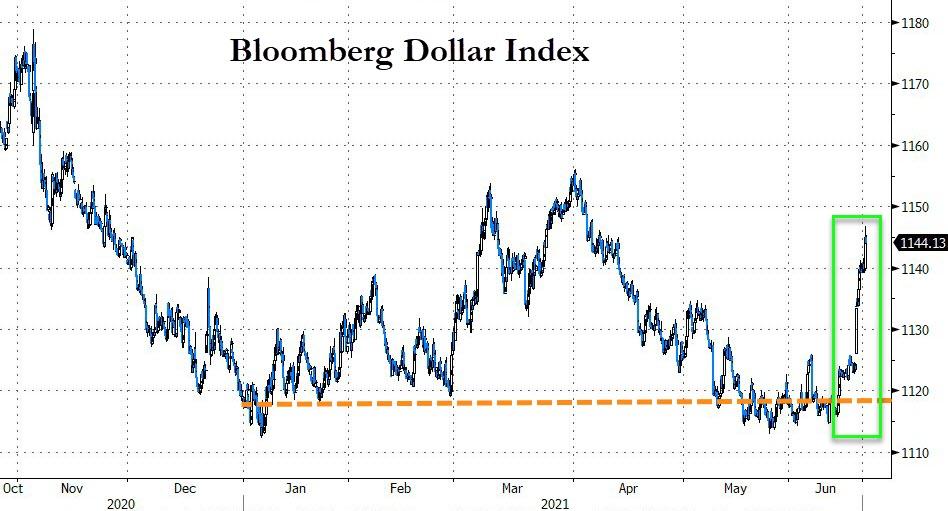
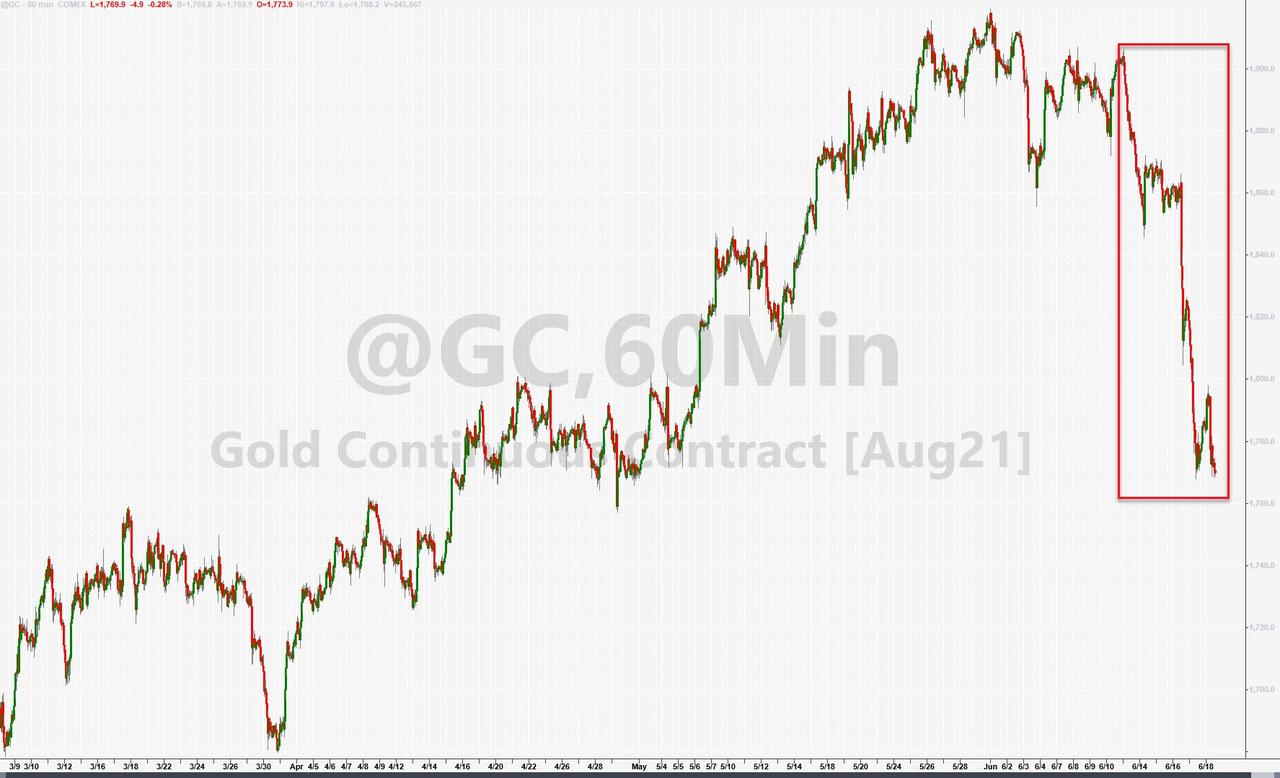
Despite getting hammered recently, commodities managed a bounce-back today, the US Dollar Index spiked sharply and is approaching March highs, which was enough to send gold into the basement, with the precious metal now having to climb out of a deep hole to get back to last week’s prices.
At least the always unpredictable quadruple witching hour has passed, and we will have to wait and see if traders will find market optimism over the weekend to pull the indexes out of their doldrums.
Or could it be that a bear market is in the making?
2. ETFs in the Spotlight
In case you missed the announcement and description of this section, you can read it here again.
It features some of the 10 broadly diversified domestic and sector ETFs from my HighVolume list as posted every Saturday. Furthermore, they are screened for the lowest MaxDD% number meaning they have been showing better resistance to temporary sell offs than all others over the past year.
The below table simply demonstrates the magnitude with which these ETFs are fluctuating above or below their respective individual trend lines (%+/-M/A). A break below, represented by a negative number, shows weakness, while a break above, represented by a positive percentage, shows strength.
For hundreds of ETF choices, be sure to reference Thursday’s StatSheet.
For this current domestic “Buy” cycle, here’s how some our candidates have fared:
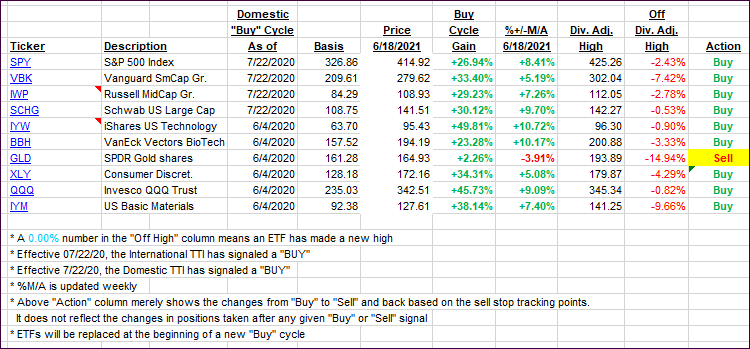
Click image to enlarge.
Again, the %+/-M/A column above shows the position of the various ETFs in relation to their respective long-term trend lines, while the trailing sell stops are being tracked in the “Off High” column. The “Action” column will signal a “Sell” once the -8% point has been taken out in the “Off High” column. For more volatile sector ETFs, the trigger point is -10%.
3. Trend Tracking Indexes (TTIs)
Our TTIs dumped as the options expiration’s session extracted their pound of flesh. A couple of our holdings are within striking distance of having reached their trailing sell stops and will be liquidated should this downward drift continue.
This is how we closed 06/18/2021:
Domestic TTI: +10.82% above its M/A (prior close +13.59%)—Buy signal effective 07/22/2020.
International TTI: +9.54% above its M/A (prior close +12.31%)—Buy signals effective 07/22/2020.
Disclosure: I am obliged to inform you that I, as well as my advisory clients, own some of the ETFs listed in the above table. Furthermore, they do not represent a specific investment recommendation for you, they merely show which ETFs from the universe I track are falling within the specified guidelines.
All linked charts above are courtesy of Bloomberg via ZeroHedge.
———————————————————-
WOULD YOU LIKE TO HAVE YOUR INVESTMENTS PROFESSIONALLY MANAGED?
Do you have the time to follow our investment plans yourself? If you are a busy professional who would like to have his portfolio managed using our methodology, please contact me directly or get more details here.
———————————————————
Back issues of the ETF Tracker are available on the web.
Contact Ulli