
ETF Tracker StatSheet
You can view the latest version here.
Treading Water
- Moving the markets
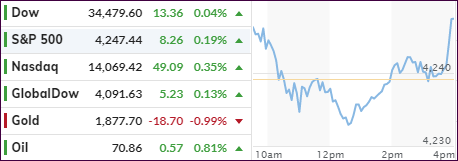
Throughout the past week, the major indexes having been treading water, and today was no exception. The S&P 500, while peeking again into record territory, managed to eke out a weekly gain of 0.37%. During this session, we saw the index pump, dump, and pump again before fading into the close.
As was to be expected, yesterday’s poor CPI report was still on traders’ minds, with one technical analyst from Piper Sandler attempting to put a lipstick on that pig:
While the May CPI report came in above estimates, the market was not too surprised and digested the data as transitory for now, the Treasury market appeared to be in agreement with the temporary inflation outlook.
Sure, it was confusing to see the bond market’s lack of recognition of these inflationary trends yesterday, as yields were dropping instead of rising, which would have been a normal reaction. However, the power of the Fed’s resolve that these current tendencies are to be considered “transitory” is a view that pleases Wall Street and therefore has contributed to the continued ramp in equities and the plunge in bond yields.
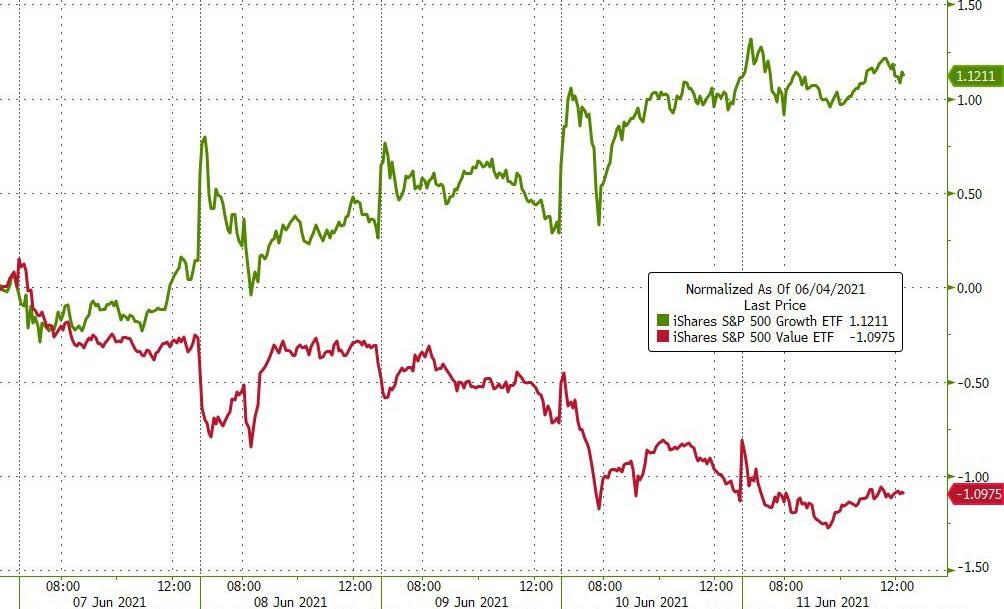
While “growth” and “value” moved in sync today, for the week “growth” came out ahead, but YTD, “value” still remains the winner.
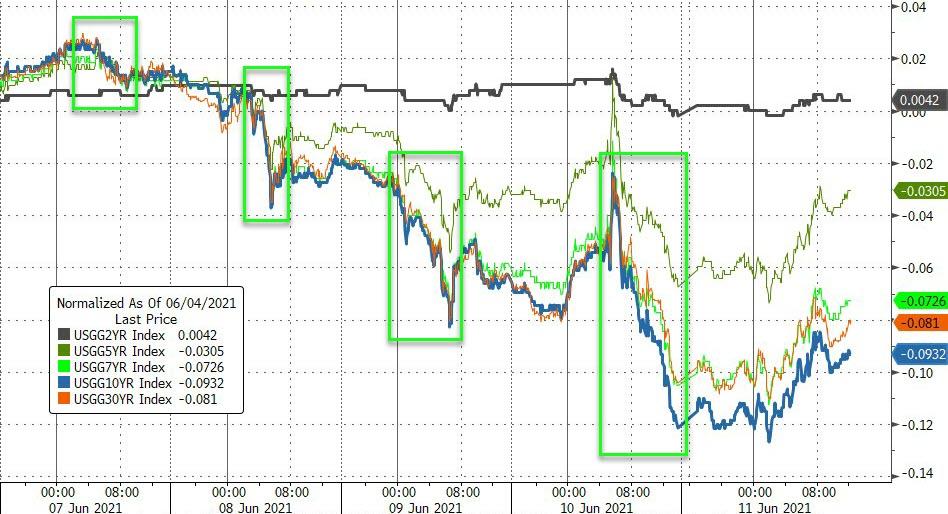
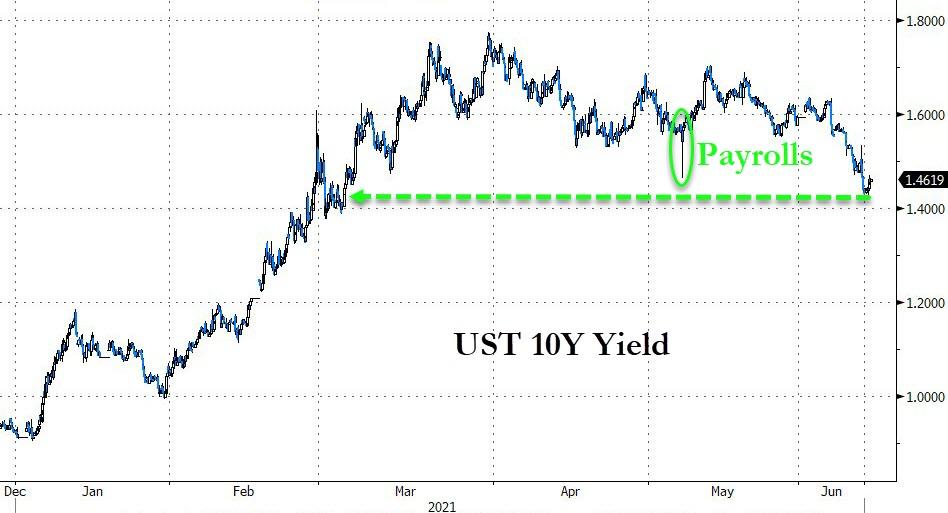
Over the past five trading days, bond yields collapsed the most in a year, as ZeroHedge pointed out, with the 10-year now reaching a level last seen the beginning of March. The US Dollar Index, after meandering all week, spiked sharply. That came as a surprise as lower yields usually pull the dollar down, but it goes to show you how much things are out of whack.
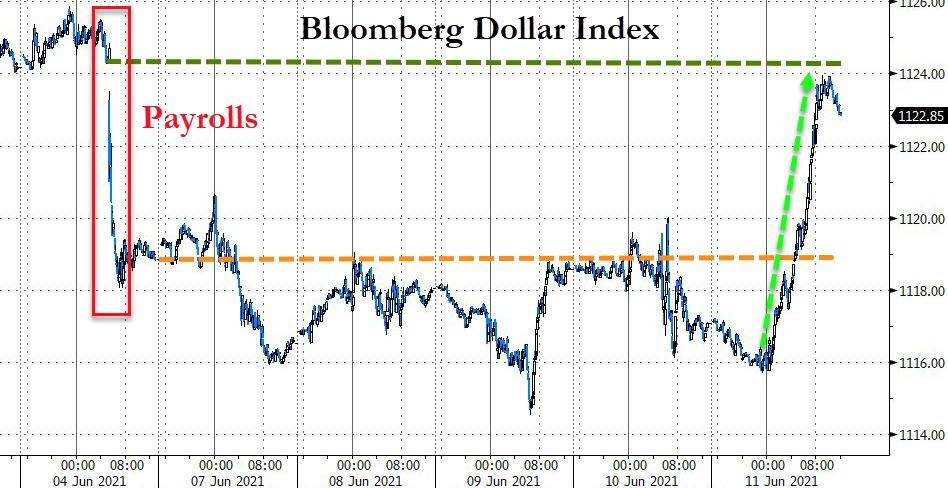
The fallout from the dollar’s surge was Gold, which got slammed by almost 1% with the precious metal again losing its $1,900 level.
Assisting the S&P 500 in making new highs is the fact that the Fed’s balance sheet continues to expand. It has reached almost $8 trillion this week, for the first time ever, and has basically doubled since the pandemic panic response, as ZeroHedge pointed out:
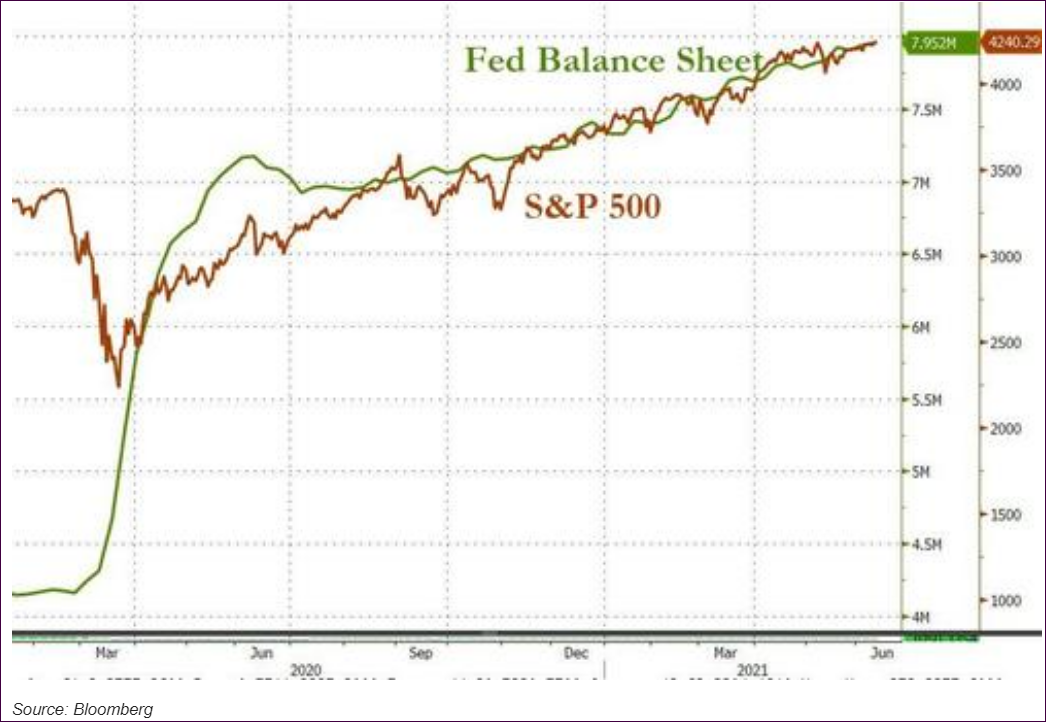
And this reckless monetary expansion continues to go on, despite the collapse of Covid, leaving me pondering “what’s next?”
2. ETFs in the Spotlight
In case you missed the announcement and description of this section, you can read it here again.
It features some of the 10 broadly diversified domestic and sector ETFs from my HighVolume list as posted every Saturday. Furthermore, they are screened for the lowest MaxDD% number meaning they have been showing better resistance to temporary sell offs than all others over the past year.
The below table simply demonstrates the magnitude with which these ETFs are fluctuating above or below their respective individual trend lines (%+/-M/A). A break below, represented by a negative number, shows weakness, while a break above, represented by a positive percentage, shows strength.
For hundreds of ETF choices, be sure to reference Thursday’s StatSheet.
For this current domestic “Buy” cycle, here’s how some our candidates have fared:
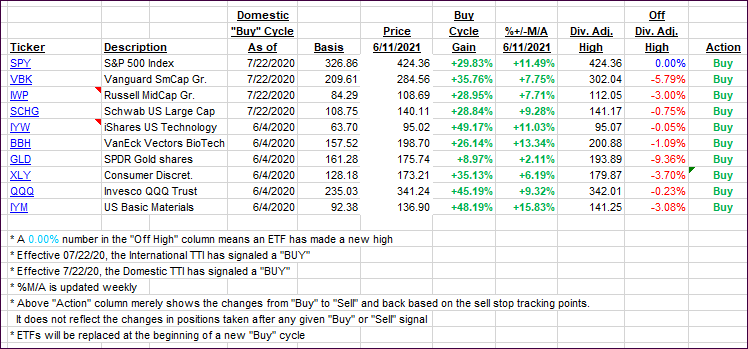
Click image to enlarge.
Again, the %+/-M/A column above shows the position of the various ETFs in relation to their respective long-term trend lines, while the trailing sell stops are being tracked in the “Off High” column. The “Action” column will signal a “Sell” once the -8% point has been taken out in the “Off High” column. For more volatile sector ETFs, the trigger point is -10%.
3. Trend Tracking Indexes (TTIs)
Our TTIs slipped as the weekly trend lines were recalculated.
This is how we closed 06/11/2021:
Domestic TTI: +15.86% above its M/A (prior close +16.57%)—Buy signal effective 07/22/2020.
International TTI: +14.43% above its M/A (prior close +15.28%)—Buy signals effective 07/22/2020.
Disclosure: I am obliged to inform you that I, as well as my advisory clients, own some of the ETFs listed in the above table. Furthermore, they do not represent a specific investment recommendation for you, they merely show which ETFs from the universe I track are falling within the specified guidelines.
All linked charts above are courtesy of Bloomberg via ZeroHedge.
———————————————————-
WOULD YOU LIKE TO HAVE YOUR INVESTMENTS PROFESSIONALLY MANAGED?
Do you have the time to follow our investment plans yourself? If you are a busy professional who would like to have his portfolio managed using our methodology, please contact me directly or get more details here.
———————————————————
Back issues of the ETF Tracker are available on the web.
Contact Ulli