
- Moving the markets
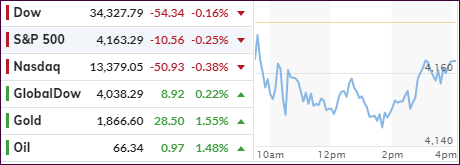
Last week was a roller coaster ride with the S&P 500 dropping some 4% in the first three trading days but making up most of it during the last two and ending down only 1.4%.
The Nasdaq fared the worst and continued this trend this morning by leading the other two major indexes to the downside, as an early drop put traders on edge. The rotation out of growth stocks kept punishing the tech sector while benefiting the cyclical and value arenas.
Today’s action showed that Small Caps and QQQs were on the selling block, losing 0.64% and 0.61% respectively, whereas the value ETF RPV eked out a 0.52% gain, along with the Small Cap Value fund IJS, which added 0.58%.
In the end, however, this afternoon’s bounce-back severely reduced the early morning losses, making the red numbers appear less daunting.
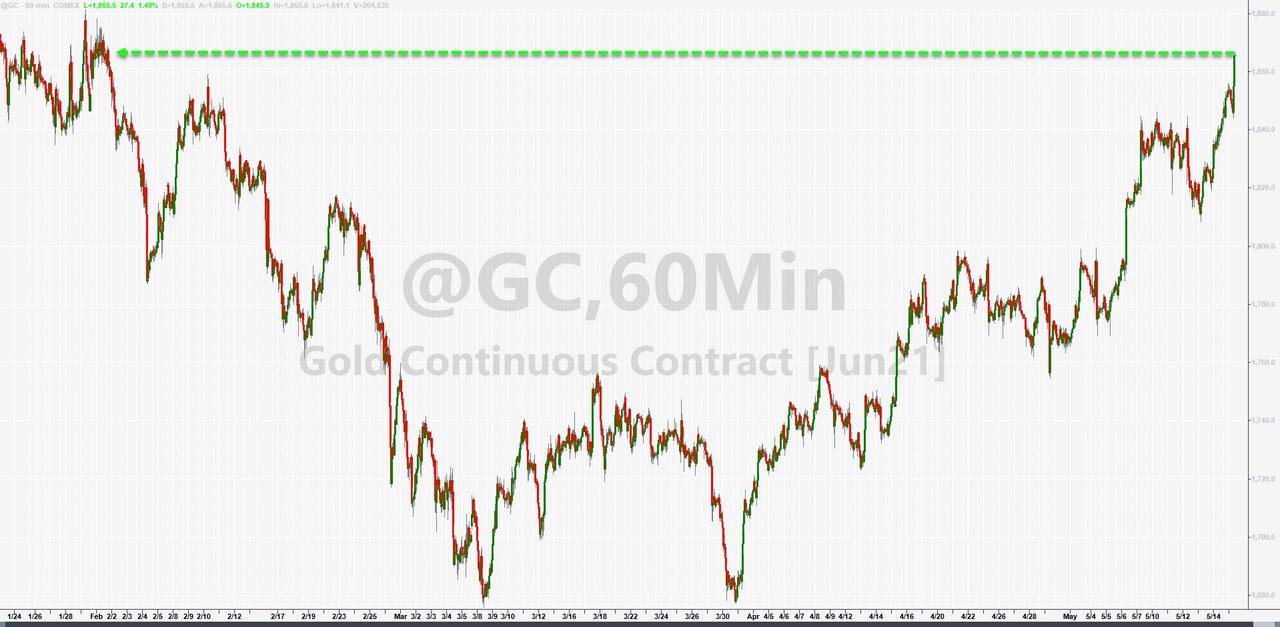
Last week’s inflationary numbers of the CPI/PPI releases finally caused some discomfort, which explains not only the above rotations, but also that Gold may after all still have validity in investors’ portfolios. That meme was on everybody’s mind today, as the Gold ETF GLD rallied not only 1.18% but also recaptured its long lost $1,800 level and closed at its highest point since January.
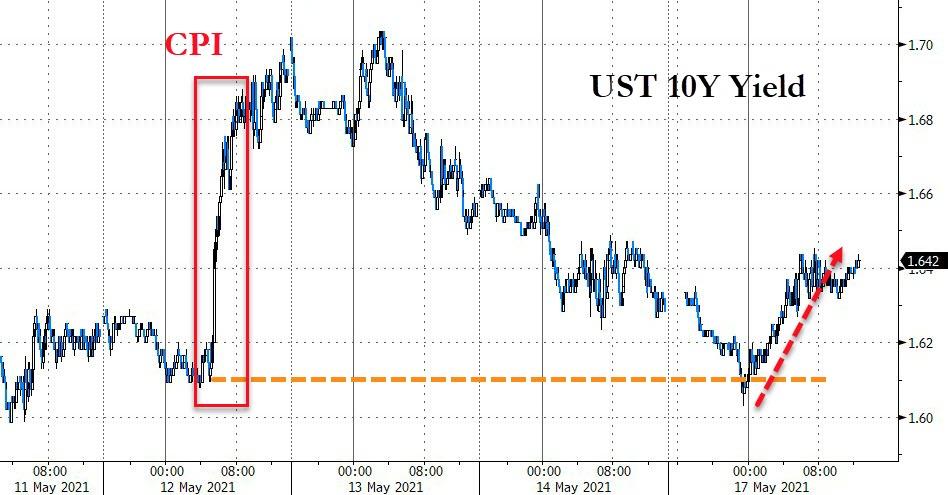
The 10-year bond yield roundtripped and inched higher into the close after an early morning drop. However, we’re still below the highs of last week, which exceeded the 1.7% level when the CPI number was released.
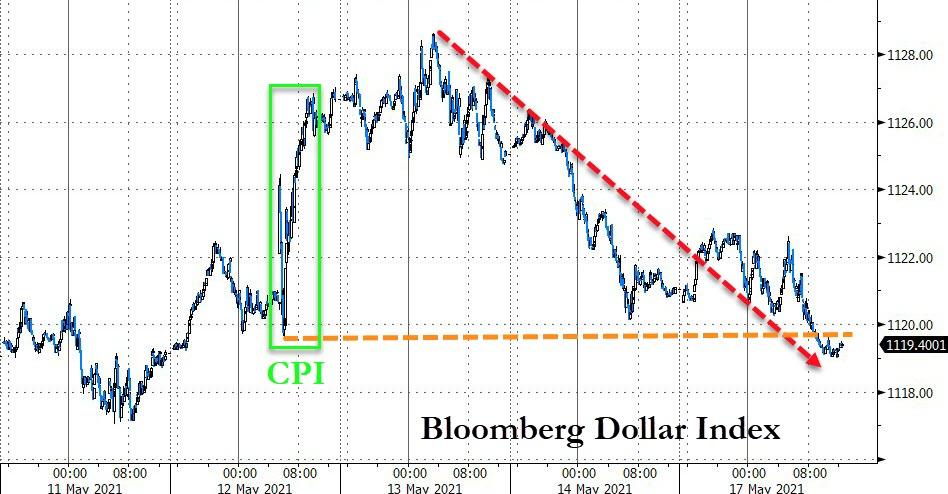
The US Dollar Index eased up after last week’s rally and settled at a level that is close to where it was before bond yields ramped higher last Wednesday.
With inflationary forces (CPI/PPI) being opposed by an economic slowdown (disappointing job creations), it will be just a matter of time before the dreaded “S” word, as in Stagflation, will be uttered by the mainstream media.
That leaves me pondering: “how will equities react?”
2. ETFs in the Spotlight
In case you missed the announcement and description of this section, you can read it here again.
It features some of the 10 broadly diversified domestic and sector ETFs from my HighVolume list as posted every Saturday. Furthermore, they are screened for the lowest MaxDD% number meaning they have been showing better resistance to temporary sell offs than all others over the past year.
The below table simply demonstrates the magnitude with which these ETFs are fluctuating above or below their respective individual trend lines (%+/-M/A). A break below, represented by a negative number, shows weakness, while a break above, represented by a positive percentage, shows strength.
For hundreds of ETF choices, be sure to reference Thursday’s StatSheet.
For this current domestic “Buy” cycle, here’s how some our candidates have fared:
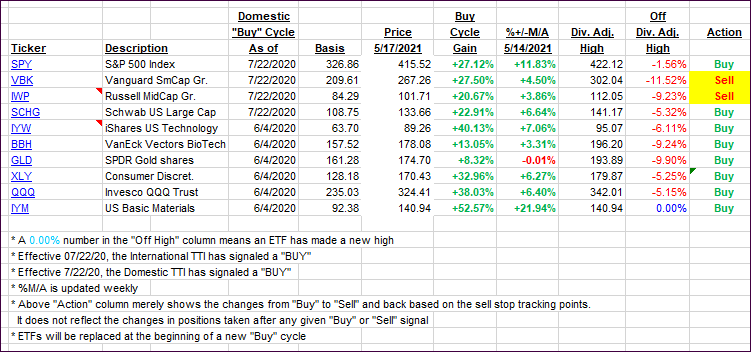
Click image to enlarge.
Again, the %+/-M/A column above shows the position of the various ETFs in relation to their respective long-term trend lines, while the trailing sell stops are being tracked in the “Off High” column. The “Action” column will signal a “Sell” once the -8% point has been taken out in the “Off High” column. For more volatile sector ETFs, the trigger point is -10%.
3. Trend Tracking Indexes (TTIs)
Our TTIs went opposite direction with the Domestic one slipping a tad, while the International one edged higher.
This is how we closed 05/17/2021:
Domestic TTI: +18.19% above its M/A (prior close +18.32%)—Buy signal effective 07/22/2020.
International TTI: +16.05% above its M/A (prior close +16.31%)—Buy signals effective 07/22/2020.
Disclosure: I am obliged to inform you that I, as well as my advisory clients, own some of the ETFs listed in the above table. Furthermore, they do not represent a specific investment recommendation for you, they merely show which ETFs from the universe I track are falling within the specified guidelines.
All linked charts above are courtesy of Bloomberg via ZeroHedge.
Contact Ulli