
- Moving the markets
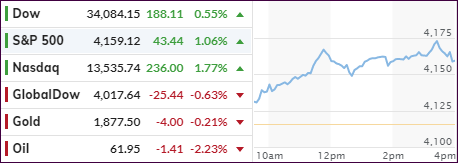
After three days of losses, the major indexes found some footing which, despite some ups and downs, provided enough upward momentum to ensure a green close. For a change, the Nasdaq led the way with a solid, yet long overdue rebound of 1.77%.
On the economic front, we learned that first-time claims for unemployment fell to 444k in the past week, better than the expected 452k, which is the lowest since March 14, 2020. If this trend can hold, we will finally make some progress and head in the right direction.
Today’s bounce-back included Small Caps and predominantly the tech sector with “value” lagging, as the Nasdaq took the limelight.
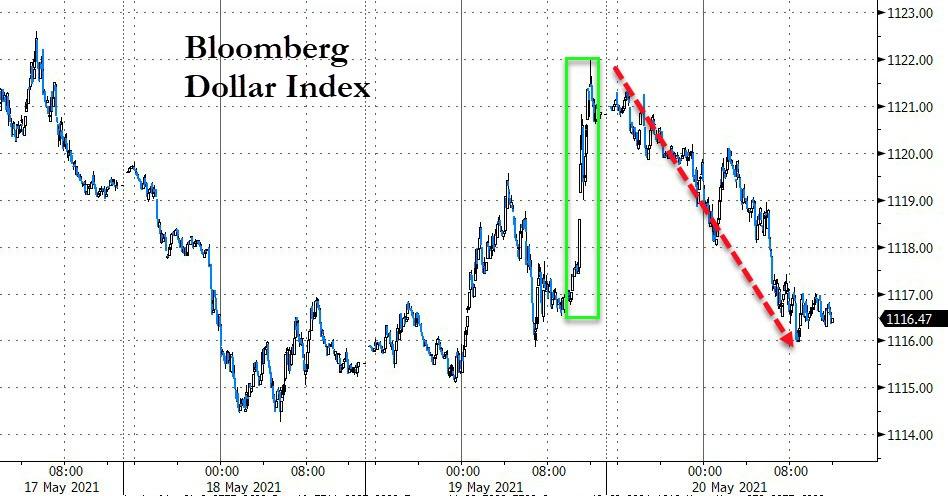
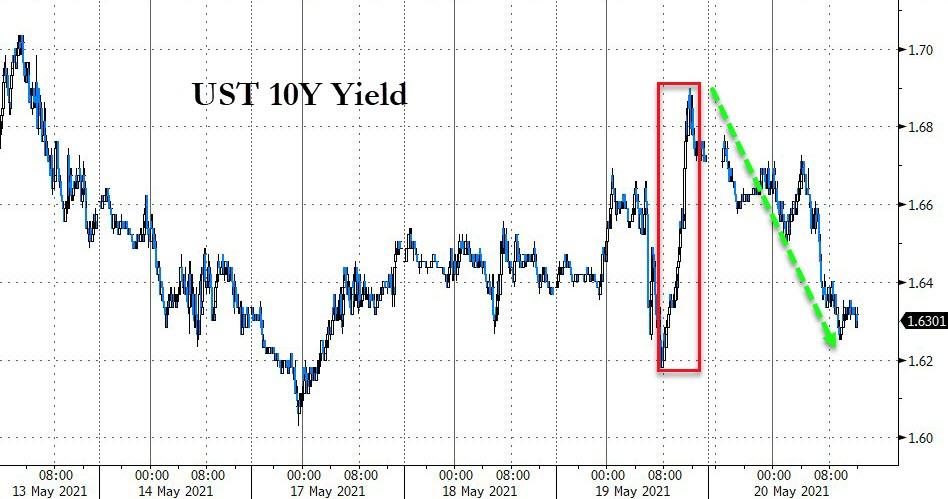
The US Dollar, which spiked Wednesday, lost its stamina, and gave up all of yesterday’s gains. Part of the reason was the drop in bond yields with the 10-year retracing its recent run. As is the case when that duo collapses in unison, the beneficiary ends up being gold. Today was no exception, and the Gold ETF GLD added +0.43%.
On deck tomorrow will be options expirations, which can increase volatility and influence markets negatively, but that does not mean that the long-term bullish trend will be violated.
2. ETFs in the Spotlight
In case you missed the announcement and description of this section, you can read it here again.
It features some of the 10 broadly diversified domestic and sector ETFs from my HighVolume list as posted every Saturday. Furthermore, they are screened for the lowest MaxDD% number meaning they have been showing better resistance to temporary sell offs than all others over the past year.
The below table simply demonstrates the magnitude with which these ETFs are fluctuating above or below their respective individual trend lines (%+/-M/A). A break below, represented by a negative number, shows weakness, while a break above, represented by a positive percentage, shows strength.
For hundreds of ETF choices, be sure to reference Thursday’s StatSheet.
For this current domestic “Buy” cycle, here’s how some our candidates have fared:
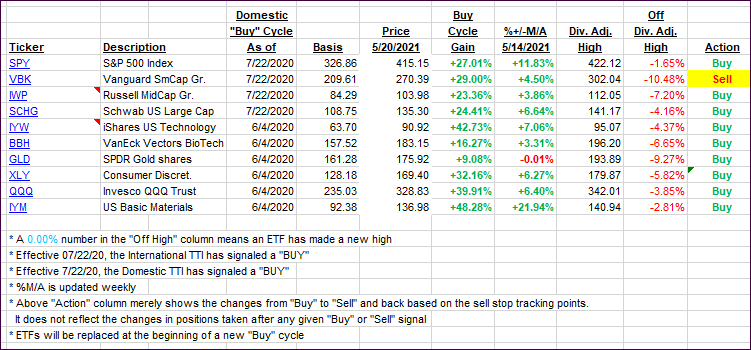
Click image to enlarge.
Again, the %+/-M/A column above shows the position of the various ETFs in relation to their respective long-term trend lines, while the trailing sell stops are being tracked in the “Off High” column. The “Action” column will signal a “Sell” once the -8% point has been taken out in the “Off High” column. For more volatile sector ETFs, the trigger point is -10%.
3. Trend Tracking Indexes (TTIs)
Our TTIs bounced for the first time in the past 4 sessions, as the bulls finally flexed some muscle.
This is how we closed 05/20/2021:
Domestic TTI: +17.42% above its M/A (prior close +16.54%)—Buy signal effective 07/22/2020.
International TTI: +15.71% above its M/A (prior close +15.13%)—Buy signals effective 07/22/2020.
Disclosure: I am obliged to inform you that I, as well as my advisory clients, own some of the ETFs listed in the above table. Furthermore, they do not represent a specific investment recommendation for you, they merely show which ETFs from the universe I track are falling within the specified guidelines.
All linked charts above are courtesy of Bloomberg via ZeroHedge.
Contact Ulli