
- Moving the markets
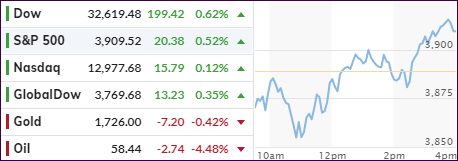
Another day, another roller coaster ride. Sharp early losses were wiped out, as the markets did a U-turn with the major indexes ending moderately in the green. One of our more volatile SmallCap holdings had triggered its trailing sell stop last night and was sold.
Fed head Powell contributed to the early sell-off with these comments:
Fed Chairman Jerome Powell said the economy has recovered more quickly than expected thanks largely to stimulus and vaccines.
That will allow the central bank at some point to roll back some of its help, though he said that will happen “very gradually … and with great transparency.”
That spooked equities, which already had given a new definition to the rollercoaster name, but in the end the markets managed to crawl back out of that early hole with airlines and cruise line operators leading the rebound.
In economic news, Initial Jobless Claims fell below the 700k (to 684k) marker for the first time since the start of the pandemic. This was offset by news that the total number of Americans claiming some form of unemployment disappointingly rose last week, back above 19 million, according to ZH.
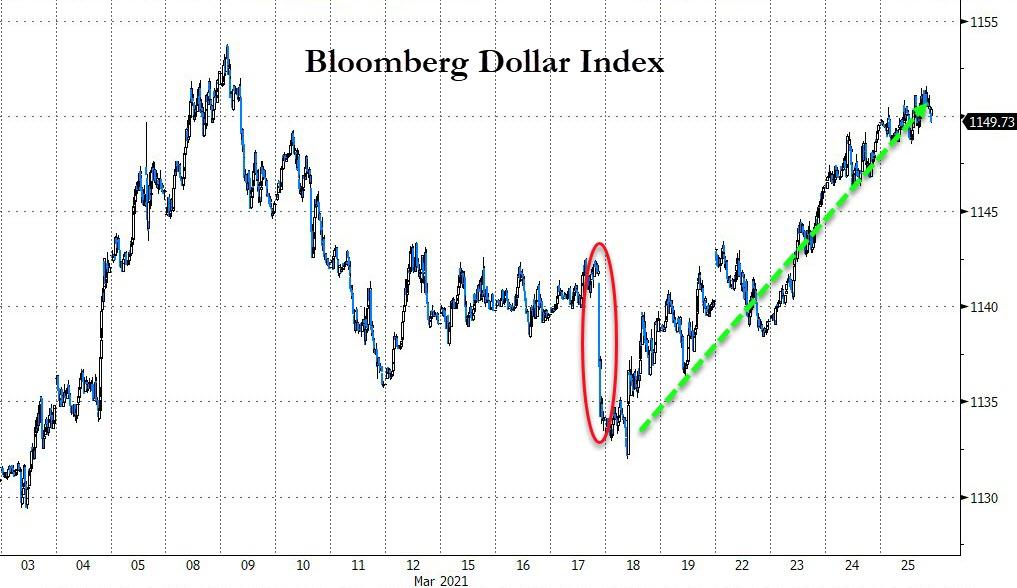
The US Dollar continued its rebound thereby taking the starch out of gold’s early leap and pulling the precious metal back into the red. Bond yields bobbed around their unchanged lines with the 10-year ending slightly higher, but the move was too small to have any effect on the markets.
I expect this type of volatility to continue and quarter-ending rebalancing to come into play for the remainder of this month.
2. ETFs in the Spotlight
In case you missed the announcement and description of this section, you can read it here again.
It features some of the 10 broadly diversified domestic and sector ETFs from my HighVolume list as posted every Saturday. Furthermore, they are screened for the lowest MaxDD% number meaning they have been showing better resistance to temporary sell offs than all others over the past year.
The below table simply demonstrates the magnitude with which these ETFs are fluctuating above or below their respective individual trend lines (%+/-M/A). A break below, represented by a negative number, shows weakness, while a break above, represented by a positive percentage, shows strength.
For hundreds of ETF choices, be sure to reference Thursday’s StatSheet.
For this current domestic “Buy” cycle, here’s how some our candidates have fared:
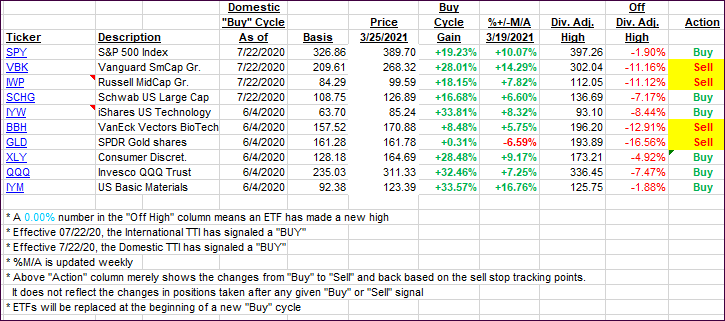
Click image to enlarge.
Again, the %+/-M/A column above shows the position of the various ETFs in relation to their respective long-term trend lines, while the trailing sell stops are being tracked in the “Off High” column. The “Action” column will signal a “Sell” once the -8% point has been taken out in the “Off High” column. For more volatile sector ETFs, the trigger point is -10%.
3. Trend Tracking Indexes (TTIs)
Our TTIs bounced higher when the markets recovered mid-day.
This is how we closed 3/25/2021:
Domestic TTI: +17.53% above its M/A (prior close +16.14%)—Buy signal effective 07/22/2020.
International TTI: +15.40% above its M/A (prior close +14.92%)—Buy signals effective 07/22/2020.
Disclosure: I am obliged to inform you that I, as well as my advisory clients, own some of the ETFs listed in the above table. Furthermore, they do not represent a specific investment recommendation for you, they merely show which ETFs from the universe I track are falling within the specified guidelines.
Contact Ulli