
ETF Tracker StatSheet
You can view the latest version here.
THUNDERING INTO THE CLOSE
- Moving the markets
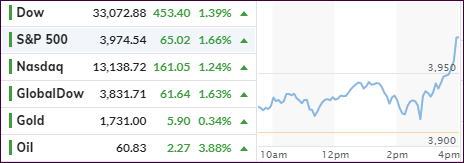
After meandering sideways for most of the session, the major indexes picked up steam during the last hour and ended a rollercoaster week solidly in the green. The Dow recaptured its 33k level, the Nasdaq jumped back above 13k, and the S&P 5000 is again within striking distance of a new milestone marker, namely the 4k point.
Traders apparently decided to look past the potential supply chain troubles, caused by a stranded container ship in the Suez Canal, and focused optimistically on vaccination targets and economic progress due to re-openings.
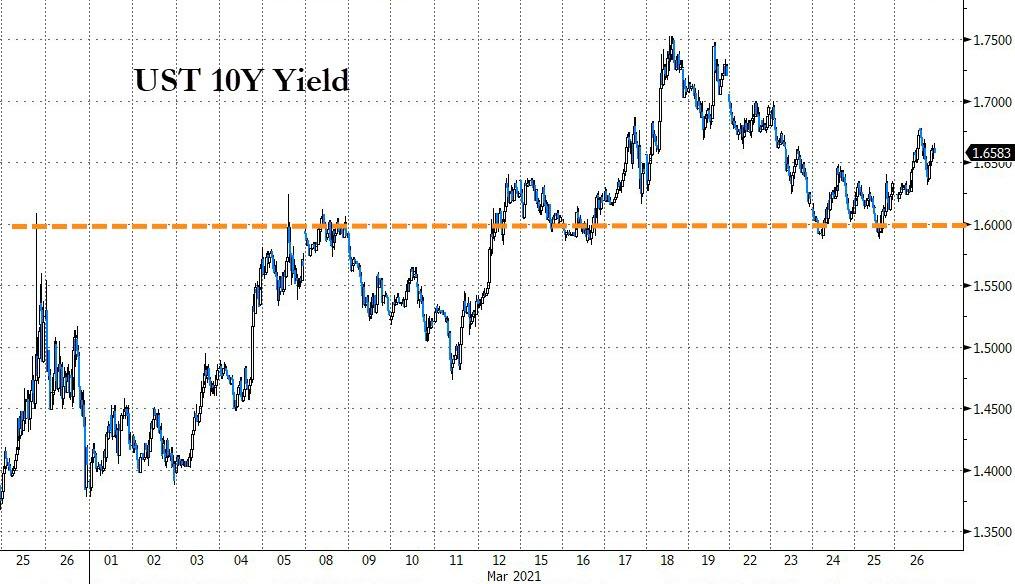
Even rising bond yields could not stop this sudden enthusiasm, which also received an assist from the Fed’s announcement that banks could resume buybacks and raise dividends starting at the end of June. That helped the financial sector (XLF) to gain +1.67%.
After being clobbered all week, SmallCaps managed a last hour melt up to close in the green, but it remains to be seen if this can be sustained.
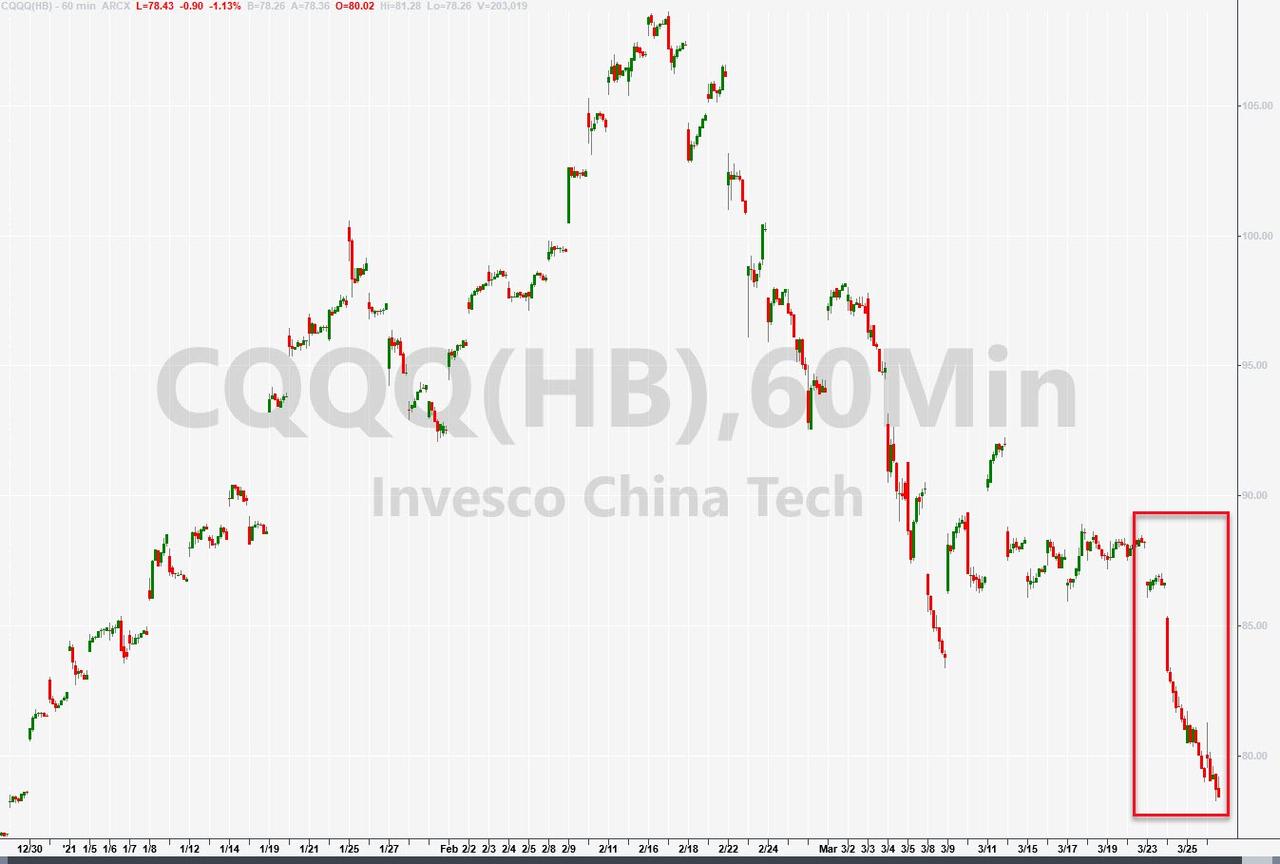
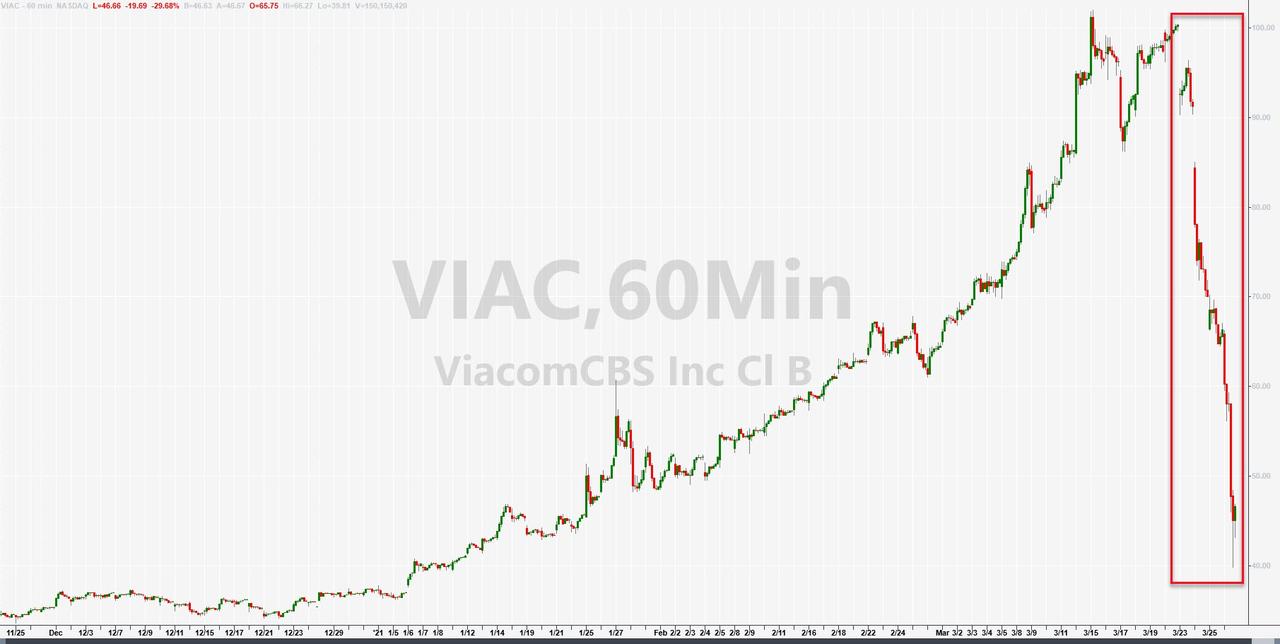
As ZH reported, it was not just US Tech that suffered, there was a major liquidation in China tech stocks as well, but the losers of the week were media stocks, which were monkey hammered and saw their biggest weekly drop since March 2020.
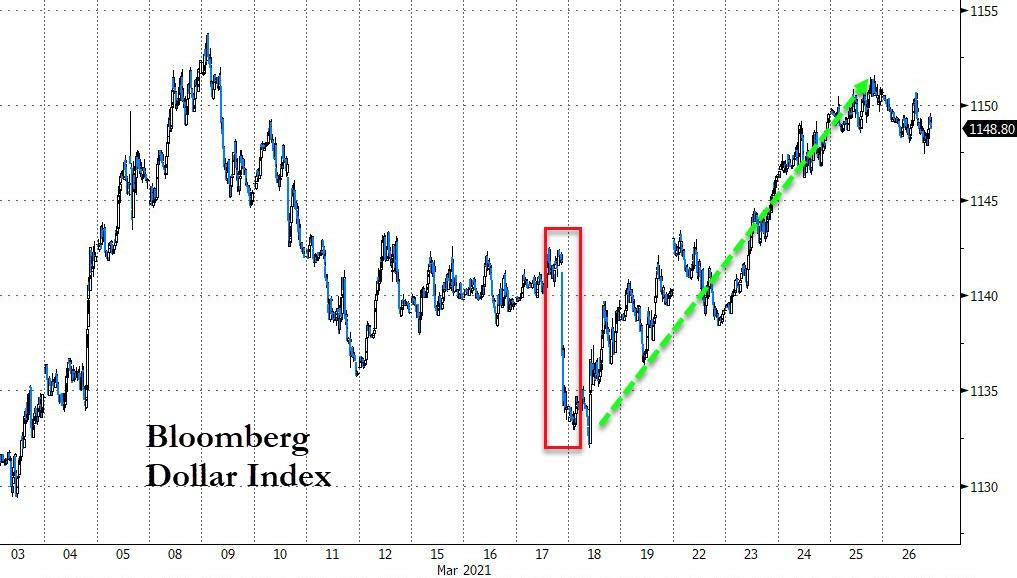
The US Dollar ramp, which eased a little today, finally allowed gold to score a small gain of +0.37%.
We have three more trading days to close out the quarter with some forecasts calling for increased volatility due to quarter-ending adjustments by mutual funds and other modeled entities.
2. ETFs in the Spotlight
In case you missed the announcement and description of this section, you can read it here again.
It features some of the 10 broadly diversified domestic and sector ETFs from my HighVolume list as posted every Saturday. Furthermore, they are screened for the lowest MaxDD% number meaning they have been showing better resistance to temporary sell offs than all others over the past year.
The below table simply demonstrates the magnitude with which these ETFs are fluctuating above or below their respective individual trend lines (%+/-M/A). A break below, represented by a negative number, shows weakness, while a break above, represented by a positive percentage, shows strength.
For hundreds of ETF choices, be sure to reference Thursday’s StatSheet.
For this current domestic “Buy” cycle, here’s how some our candidates have fared:
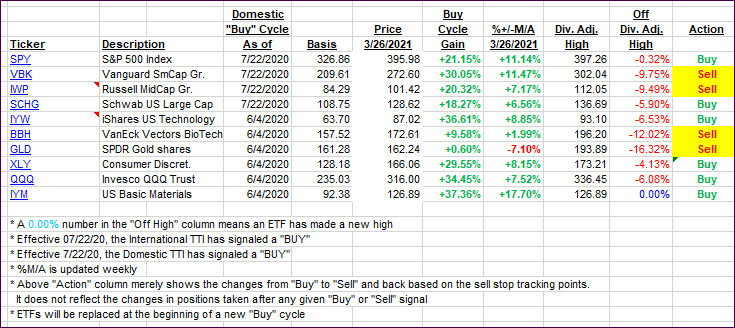
Click image to enlarge.
Again, the %+/-M/A column above shows the position of the various ETFs in relation to their respective long-term trend lines, while the trailing sell stops are being tracked in the “Off High” column. The “Action” column will signal a “Sell” once the -8% point has been taken out in the “Off High” column. For more volatile sector ETFs, the trigger point is -10%.
3. Trend Tracking Indexes (TTIs)
Our TTIs jumped as the broad market pumped into the close.
This is how we closed 3/26/2021:
Domestic TTI: +19.12% above its M/A (prior close +17.53%)—Buy signal effective 07/22/2020.
International TTI: +16.34% above its M/A (prior close +15.40%)—Buy signals effective 07/22/2020.
Disclosure: I am obliged to inform you that I, as well as my advisory clients, own some of the ETFs listed in the above table. Furthermore, they do not represent a specific investment recommendation for you, they merely show which ETFs from the universe I track are falling within the specified guidelines.
———————————————————-
WOULD YOU LIKE TO HAVE YOUR INVESTMENTS PROFESSIONALLY MANAGED?
Do you have the time to follow our investment plans yourself? If you are a busy professional who would like to have his portfolio managed using our methodology, please contact me directly or get more details here.
———————————————————
Back issues of the ETF Tracker are available on the web.
Contact Ulli