
- Moving the markets
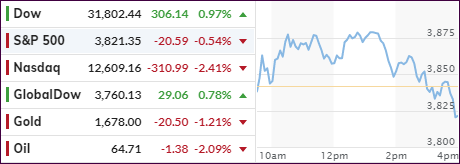
The futures markets already indicated uncertainty, causing the Nasdaq to stumble, a trend that accelerated during the regular session with the index surrendering some -2.41%. This validated my thoughts of leaving the tech sector last week in favor of “value,” which so far has been the correct call.
The Dow was unaffected by today’s roller coaster ride, during which the S&P 500 spent most of the session in the green but dove below its unchanged line at the close.
Some traders perceived today’s action, after Friday’s wild trip, as chaos with one frantic call shouting “this is f**king crazy…the whole market is trading like a penny stock…”
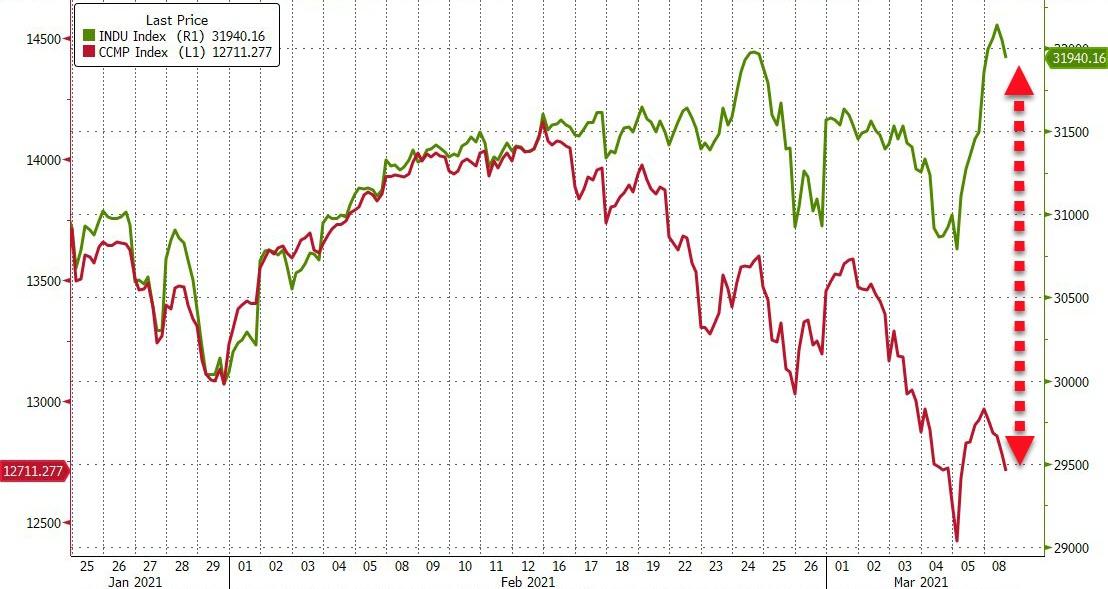
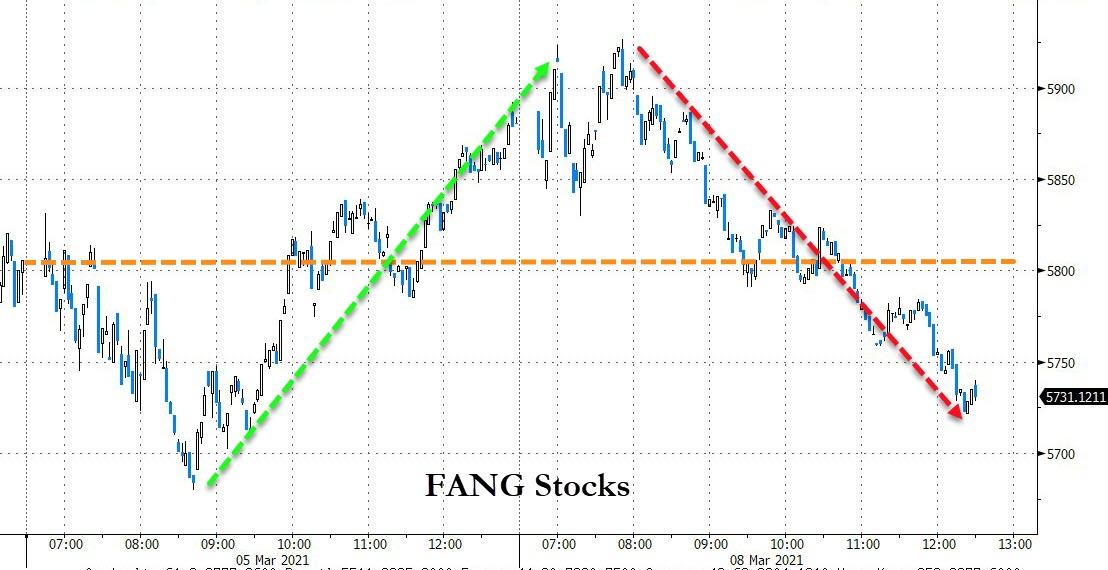
How crazy? As ZH pointed out, for the first time since 1993, the Dow is at a record while the Nasdaq is down around 10% from its high, as Bloomberg shows here. FANG stocks have now given back most of Friday’s monster rebound, as sentiment changed from one trading day to the next.
The US Dollar continued its northerly path, support by rising bond yields with the 10-year having settled comfortably at the 1.60% marker, which pulled gold from an early gain into a late loss.
This market has the feel of being on the edge. Reckless deficits and spending orgies combined with surging bond yields will eventually exact their pound of flesh. Right now, however, there are still areas that benefit from the current conundrum, and those are the ones we focus on in my advisor practice.
2. ETFs in the Spotlight
In case you missed the announcement and description of this section, you can read it here again.
It features some of the 10 broadly diversified domestic and sector ETFs from my HighVolume list as posted every Saturday. Furthermore, they are screened for the lowest MaxDD% number meaning they have been showing better resistance to temporary sell offs than all others over the past year.
The below table simply demonstrates the magnitude with which these ETFs are fluctuating above or below their respective individual trend lines (%+/-M/A). A break below, represented by a negative number, shows weakness, while a break above, represented by a positive percentage, shows strength.
For hundreds of ETF choices, be sure to reference Thursday’s StatSheet.
For this current domestic “Buy” cycle, here’s how some our candidates have fared:
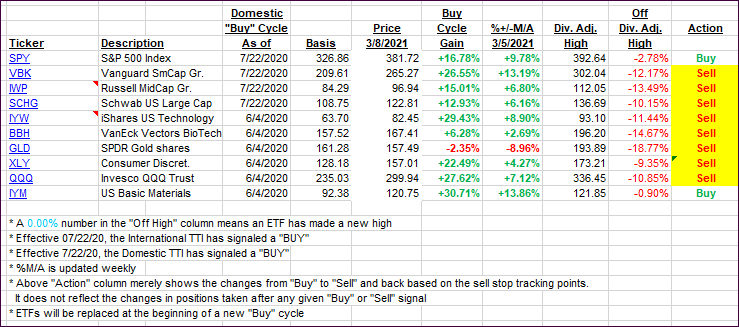
Click image to enlarge.
Again, the %+/-M/A column above shows the position of the various ETFs in relation to their respective long-term trend lines, while the trailing sell stops are being tracked in the “Off High” column. The “Action” column will signal a “Sell” once the -8% point has been taken out in the “Off High” column. For more volatile sector ETFs, the trigger point is -10%.
3. Trend Tracking Indexes (TTIs)
Our TTIs climbed a tad despite increased volatility.
This is how we closed 3/8/2021:
Domestic TTI: +18.22% above its M/A (prior close +17.44%)—Buy signal effective 07/22/2020.
International TTI: +16.97% above its M/A (prior close +16.09%)—Buy signals effective 07/22/2020.
Disclosure: I am obliged to inform you that I, as well as my advisory clients, own some of the ETFs listed in the above table. Furthermore, they do not represent a specific investment recommendation for you, they merely show which ETFs from the universe I track are falling within the specified guidelines.
Contact Ulli