
- Moving the markets
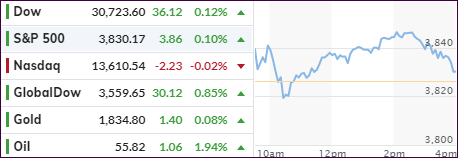
Even though the S&P 500 closed in the green for its third straight day, upward momentum took a breather with the Nasdaq slipping slightly into the red.
An early bounce faded below the unchanged line, but afternoon buying perked up the indexes, however, traders did not show much enthusiasm and tried to digest the most recent earnings wave.
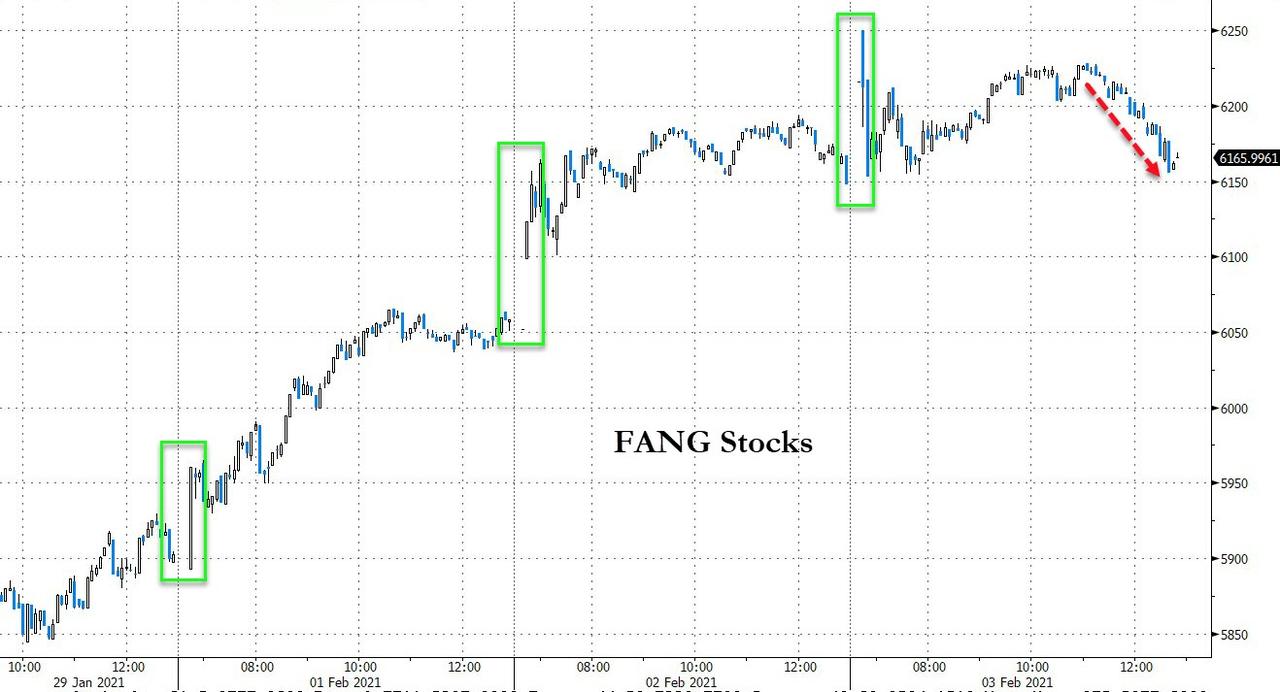
Google’s parent Alphabet jumped over 8% after reporting a chest pounding 23% in revenue growth, while topping assessments for earnings. Not to be outdone, Amazon’s earnings nearly doubled estimates, thereby pushing quarterly numbers past the symbolic $100 billion marker for the first time ever. But all this encouraging news did nothing for the Nasdaq, nor the FANG stocks, which “roller-coastered” throughout the session and ended essentially unchanged.
In the most-shorted stocks arena, the members of which got clobbered over the past few days, a tiny bit of relief was apparent, as the short-squeeze threat abated for the time being.
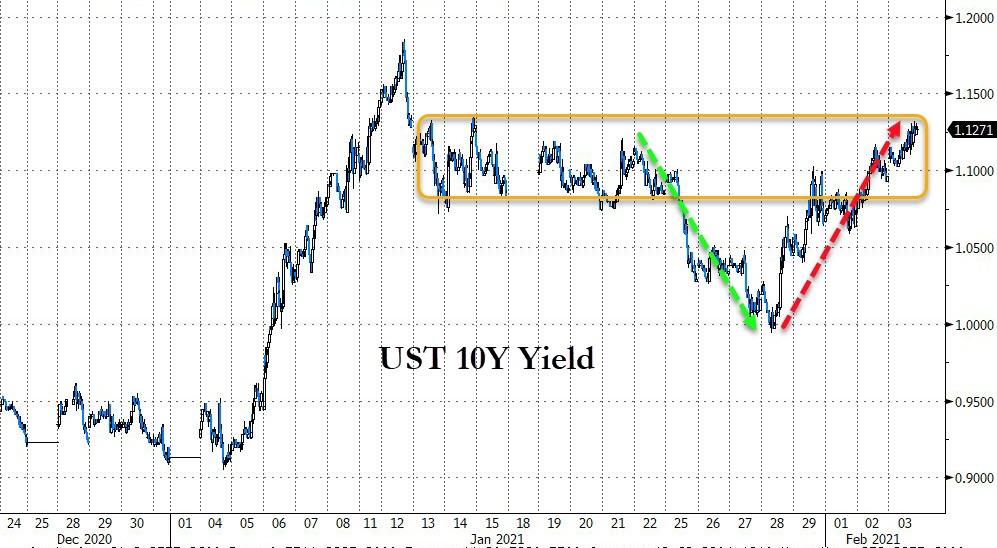
Despite bond yields rising slightly, along with the US Dollar, neither seemed to have much of an impact, and even gold could not muster any strength and ended up hugging the unchanged line.
In summary, today was non-event in terms of market direction.
2. ETFs in the Spotlight
In case you missed the announcement and description of this section, you can read it here again.
It features some of the 10 broadly diversified domestic and sector ETFs from my HighVolume list as posted every Saturday. Furthermore, they are screened for the lowest MaxDD% number meaning they have been showing better resistance to temporary sell offs than all others over the past year.
The below table simply demonstrates the magnitude with which these ETFs are fluctuating above or below their respective individual trend lines (%+/-M/A). A break below, represented by a negative number, shows weakness, while a break above, represented by a positive percentage, shows strength.
For hundreds of ETF choices, be sure to reference Thursday’s StatSheet.
For this current domestic “Buy” cycle, here’s how some our candidates have fared:
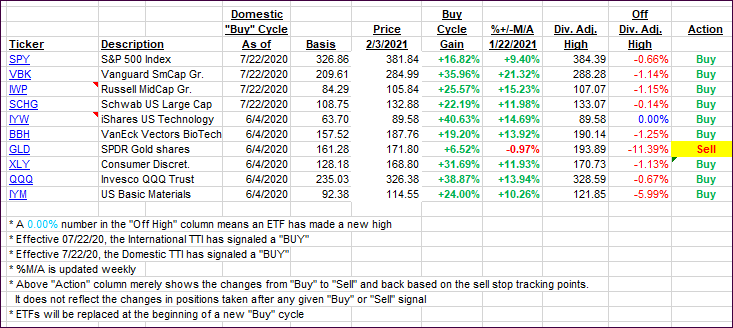
Click image to enlarge.
Again, the %+/-M/A column above shows the position of the various ETFs in relation to their respective long-term trend lines, while the trailing sell stops are being tracked in the “Off High” column. The “Action” column will signal a “Sell” once the -8% point has been taken out in the “Off High” column. For more volatile sector ETFs, the trigger point is -10%.
3. Trend Tracking Indexes (TTIs)
Our TTIs diverge with the International one jumping, while the Domestic one barely changed.
This is how we closed 2/03/2021:
Domestic TTI: +16.32% above its M/A (prior close +16.02%)—Buy signal effective 07/22/2020.
International TTI: +15.26% above its M/A (prior close +14.36%)—Buy signal effective 07/22/2020.
Disclosure: I am obliged to inform you that I, as well as my advisory clients, own some of the ETFs listed in the above table. Furthermore, they do not represent a specific investment recommendation for you, they merely show which ETFs from the universe I track are falling within the specified guidelines.
Contact Ulli