
- Moving the markets
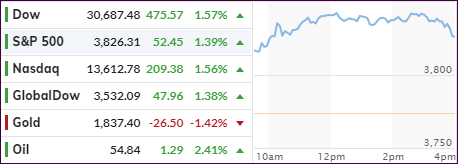
Traders felt a little more at ease this morning, as the GameStop trading slugfest continued to reverse course, at least for the time being. This formed the base for an enthusiastic pop in the markets with the Dow sporting a 600-point gain during the session.
While the ramp lost some momentum into the close, the major indexes nevertheless ended solidly in the green with all three showing similar performances. It came as no surprise that SmallCaps (IWO) again displayed superior gains of +1.92%, but today that sector was bested by MidCaps (IWP) with +2.07%, thereby leaving the Nasdaq (QQQ) in 3rd place with +1.63%.
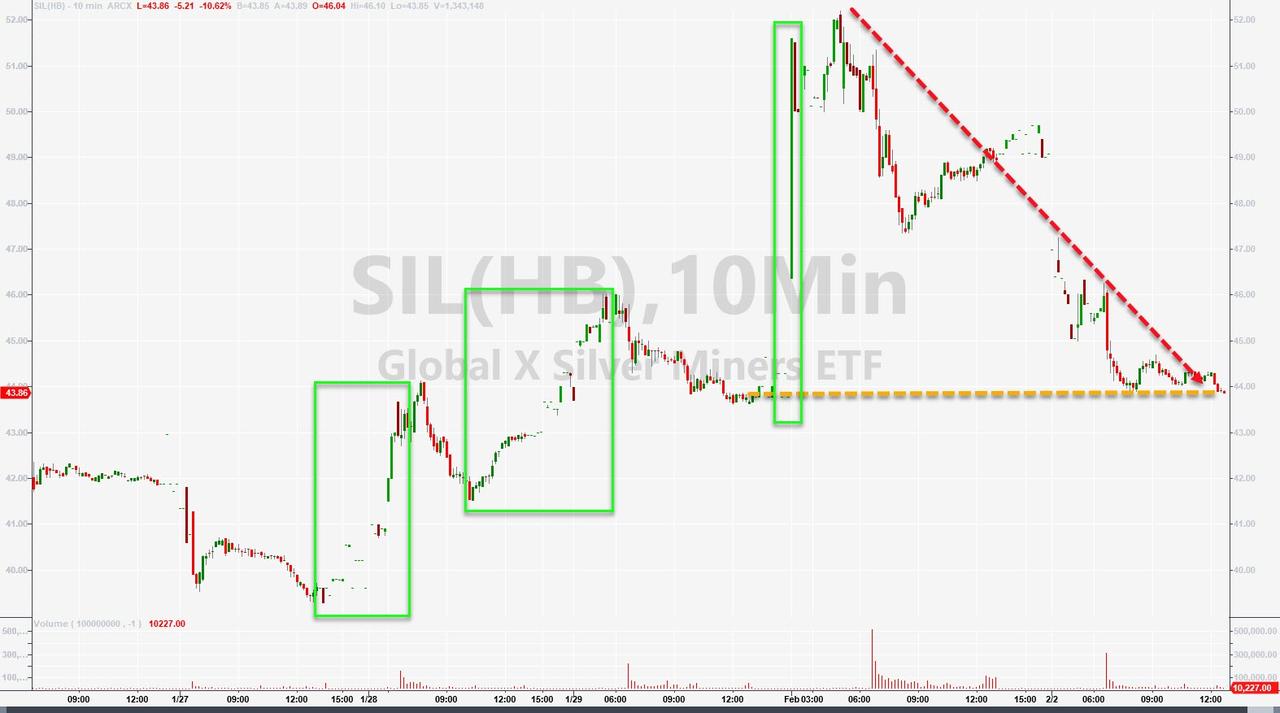
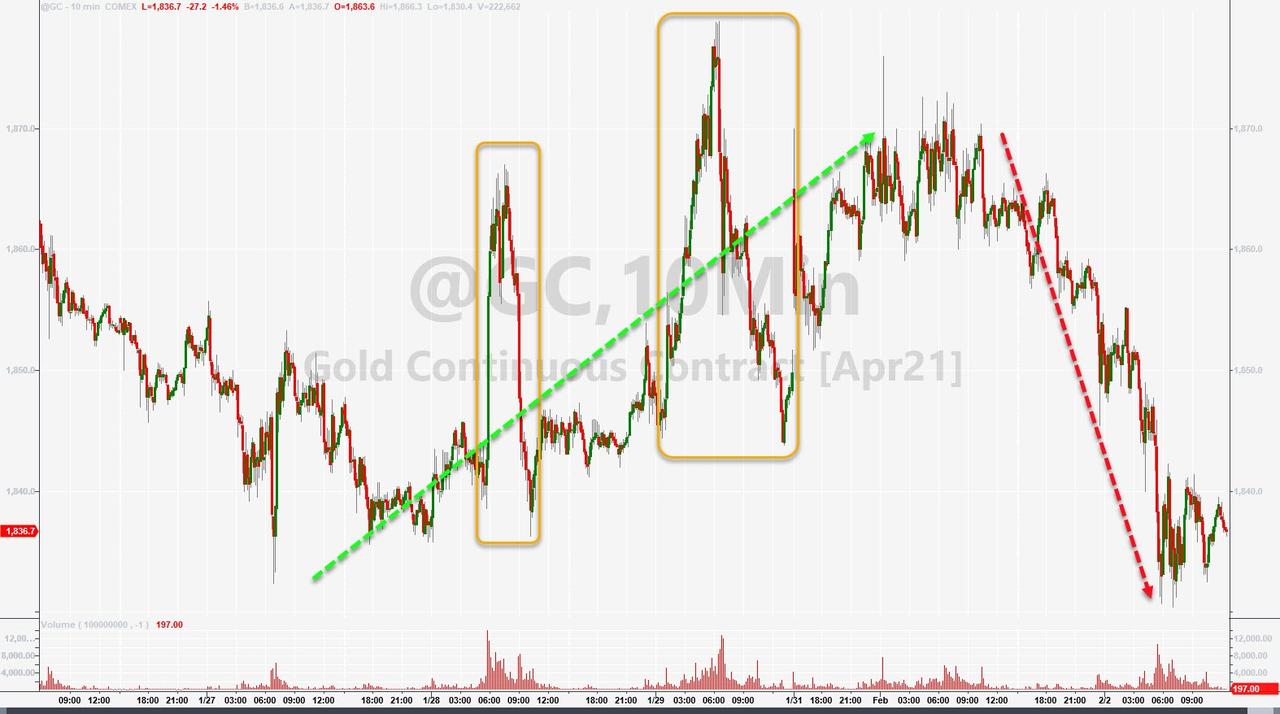
The precious metals were punished today with especially Silver taking the brunt of the beating, while Gold tumbled again below its $1,850 level. I think the silver spike is far from being over, but right now it appears to be battle between the shorts and the increasing demand for physical. Most bullion dealers on the internet are out of inventory.
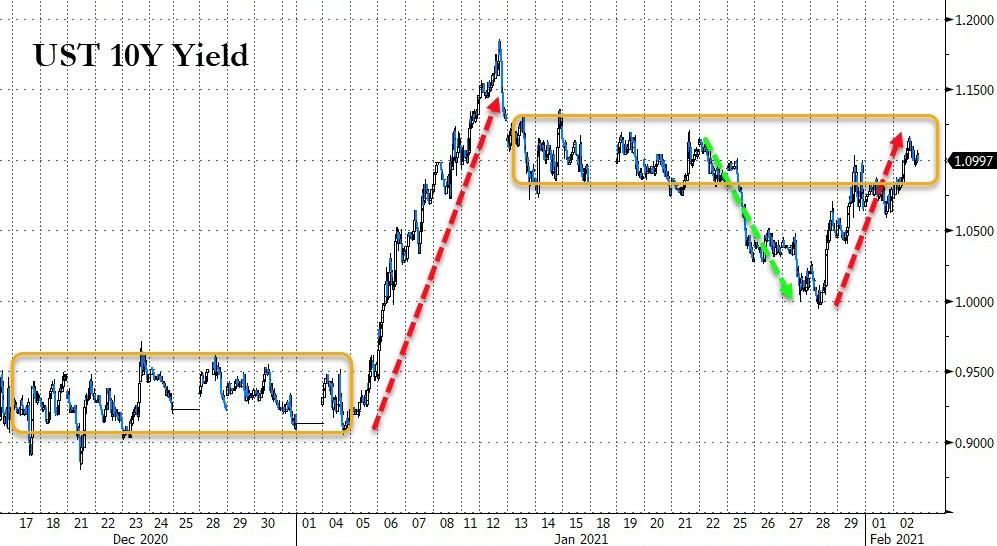
Not helping the metals were increasing bond yields with the 10-year rebounding from yesterday’s drubbing, as well as a rising US Dollar.
On deck this afternoon are earnings reports from Alphabet and Amazon, which certainly could influence tomorrow’s market direction.
2. ETFs in the Spotlight
In case you missed the announcement and description of this section, you can read it here again.
It features some of the 10 broadly diversified domestic and sector ETFs from my HighVolume list as posted every Saturday. Furthermore, they are screened for the lowest MaxDD% number meaning they have been showing better resistance to temporary sell offs than all others over the past year.
The below table simply demonstrates the magnitude with which these ETFs are fluctuating above or below their respective individual trend lines (%+/-M/A). A break below, represented by a negative number, shows weakness, while a break above, represented by a positive percentage, shows strength.
For hundreds of ETF choices, be sure to reference Thursday’s StatSheet.
For this current domestic “Buy” cycle, here’s how some our candidates have fared:
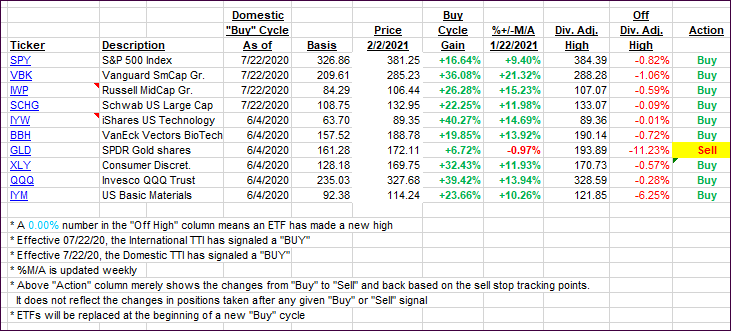
Click image to enlarge.
Again, the %+/-M/A column above shows the position of the various ETFs in relation to their respective long-term trend lines, while the trailing sell stops are being tracked in the “Off High” column. The “Action” column will signal a “Sell” once the -8% point has been taken out in the “Off High” column. For more volatile sector ETFs, the trigger point is -10%.
3. Trend Tracking Indexes (TTIs)
Our TTIs surged as the mood was buoyant on Wall Street.
This is how we closed 2/02/2021:
Domestic TTI: +16.02% above its M/A (prior close +14.51%)—Buy signal effective 07/22/2020.
International TTI: +14.36% above its M/A (prior close +12.78%)—Buy signal effective 07/22/2020.
Disclosure: I am obliged to inform you that I, as well as my advisory clients, own some of the ETFs listed in the above table. Furthermore, they do not represent a specific investment recommendation for you, they merely show which ETFs from the universe I track are falling within the specified guidelines.
Contact Ulli