
- Moving the markets
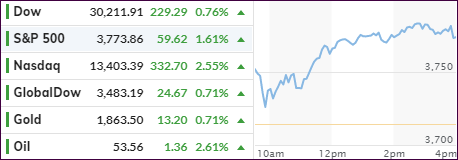
After stumbling during the last week of January, and a weak overnight session in the futures markets, the major indexes shook off whatever ailed them and opened solidly to the upside. An early dip towards the unchanged line was quickly recovered, and up we went during the remainder of the session.
Taking the lead in today’s levitation were SmallCaps (IWO), which rocketed ahead +2.72% with the Nasdaq in close pursuit via an impressive gain of +2.55%. Even GLD finally managed to hang on to most of its early gains, very likely a rollover result of the short-squeeze stampede into silver, which catapulted higher by some 11%, over $30, before surrendering some its gains.
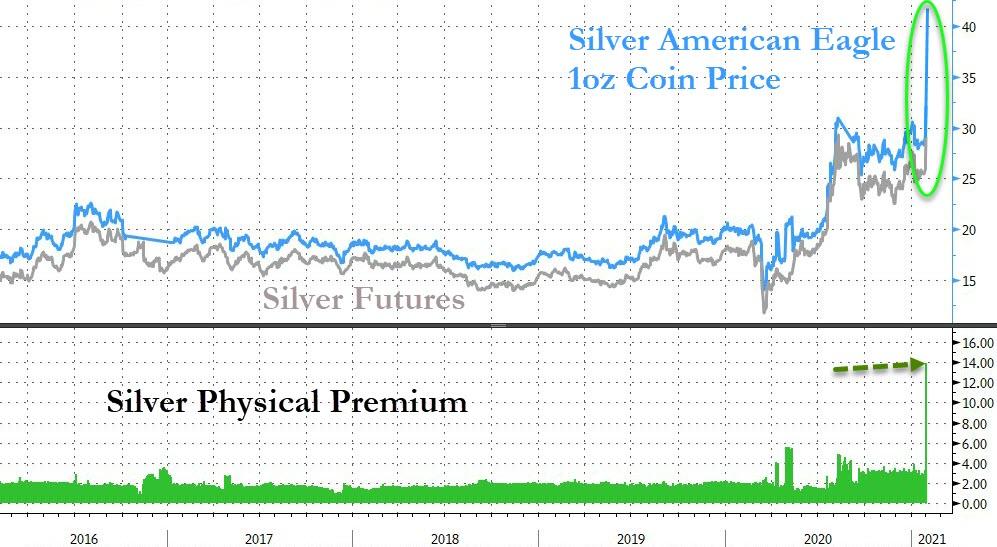
But some damage was done as the silver futures diverged heavily from the American Eagle 1 oz coin price, showing a $14 premium, as Bloomberg demonstrates in this chart.
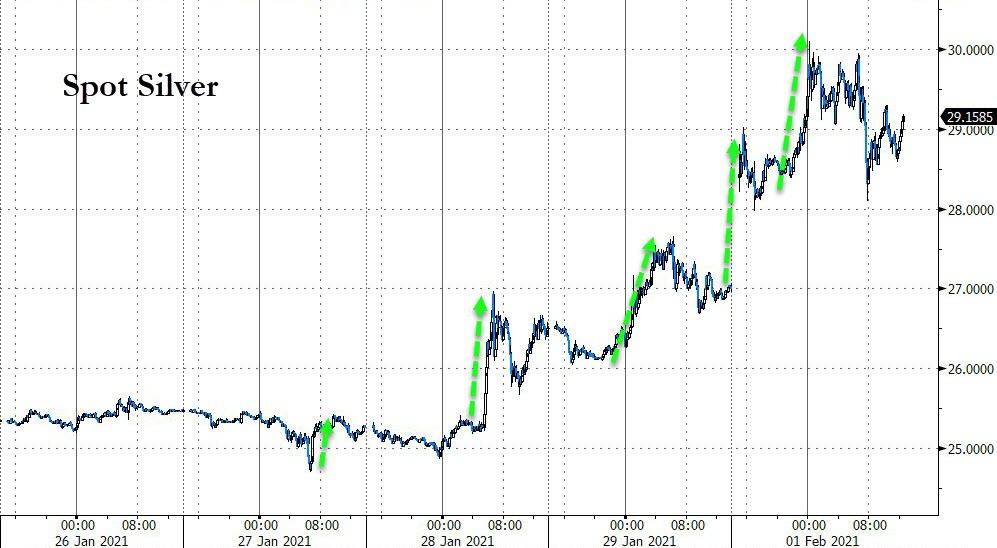
Things were quiet in the markets as Wall Street traders tried to shake off last week’s retail trading short squeeze apocalypse featuring predominantly the GameStop stock. Word had it over the weekend that the Reddit Forum WallStreetBets would now attempt a repeat of the squeeze—but in the silver markets. They appeared to have done so, but details of its impact are still sketchy.
CNBC summed it up like this:
Many on Wall Street were spooked by a frenzy of activity among retail traders in heavily shorted stocks including GameStop and AMC Entertainment, which caused hedge funds to take off risk across the board even if they weren’t directly involved in the trade. Goldman Sachs said that the short squeeze triggered by the buying spree is the most extreme in 25 years. However, some strategists believe it’s unlikely that the impact will ripple through Wall Street and derail the new bull market.
Earnings season will kick into full gear this week with names like Alphabet, Amazon, Alibaba, Exxon, and other heavyweights on deck.
2. ETFs in the Spotlight
In case you missed the announcement and description of this section, you can read it here again.
It features some of the 10 broadly diversified domestic and sector ETFs from my HighVolume list as posted every Saturday. Furthermore, they are screened for the lowest MaxDD% number meaning they have been showing better resistance to temporary sell offs than all others over the past year.
The below table simply demonstrates the magnitude with which these ETFs are fluctuating above or below their respective individual trend lines (%+/-M/A). A break below, represented by a negative number, shows weakness, while a break above, represented by a positive percentage, shows strength.
For hundreds of ETF choices, be sure to reference Thursday’s StatSheet.
For this current domestic “Buy” cycle, here’s how some our candidates have fared:
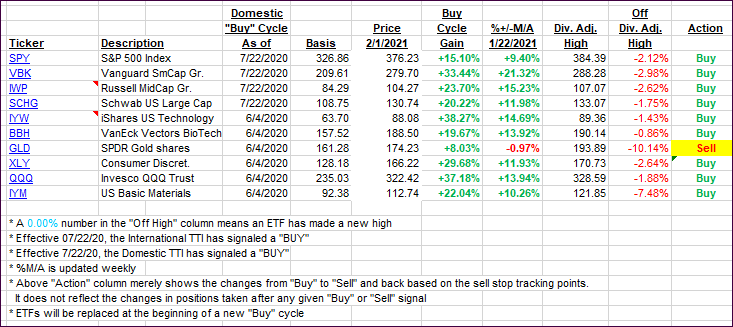
Click image to enlarge.
Again, the %+/-M/A column above shows the position of the various ETFs in relation to their respective long-term trend lines, while the trailing sell stops are being tracked in the “Off High” column. The “Action” column will signal a “Sell” once the -8% point has been taken out in the “Off High” column. For more volatile sector ETFs, the trigger point is -10%.
3. Trend Tracking Indexes (TTIs)
Our TTIs bounced back and opened February on a positive note.
This is how we closed 2/01/2021:
Domestic TTI: +14.51% above its M/A (prior close +13.01%)—Buy signal effective 07/22/2020.
International TTI: +12.78% above its M/A (prior close +11.89%)—Buy signal effective 07/22/2020.
Disclosure: I am obliged to inform you that I, as well as my advisory clients, own some of the ETFs listed in the above table. Furthermore, they do not represent a specific investment recommendation for you, they merely show which ETFs from the universe I track are falling within the specified guidelines.
Contact Ulli