
ETF Tracker StatSheet
You can view the latest version here.
STALLING FOUR DAYS IN A ROW BUT GAINING FOR THE WEEK
- Moving the markets
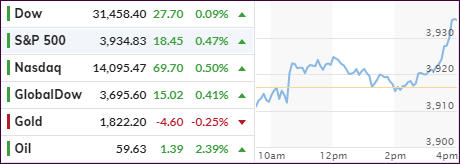
The aimless meandering of equities continued for the 4th day in a row, but a sudden ramp into the closed made today’s session a more successful one. ETF specific, SmallCaps lagged again (IWO: +0.11%), but MidCaps (IWP) picked up the speed and added +0.96% thereby trouncing the Nasdaq’s +0.50%.
Even with its tiny gain, the Dow managed to eke out another record high, following the S&P 500 and Nasdaq, which both set records yesterday in the face of only fractional advances.
Opined one analyst:
“Is the path to much higher equities becoming smaller … to put it differently, are the bulls attempting to thread a needle? Seems that way near term.”
Be that as it may, February’s performance so far has been outstanding with the Dow gaining +4.7%, while S&P 500 and Nasdaq added +5.4% and +7.1% respectively. For the year 2021, the S&P has scored nine record closes.
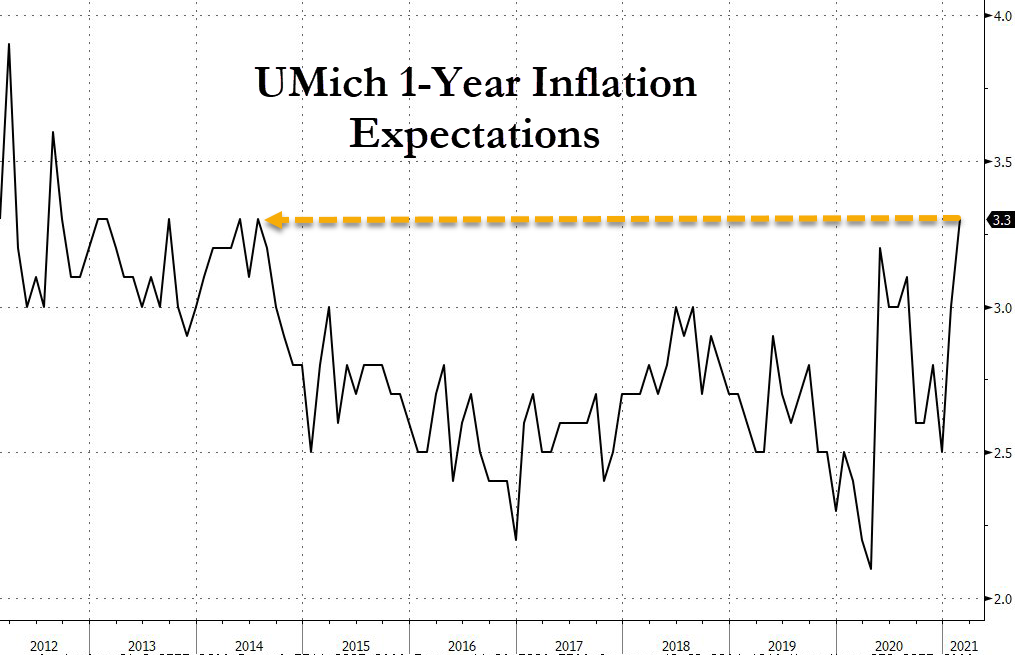
On the economic front, we learned that Consumer Sentiment declined to a six-month low due to personal income deteriorating and more Americans anticipating faster inflation in the year ahead, according to ZH.
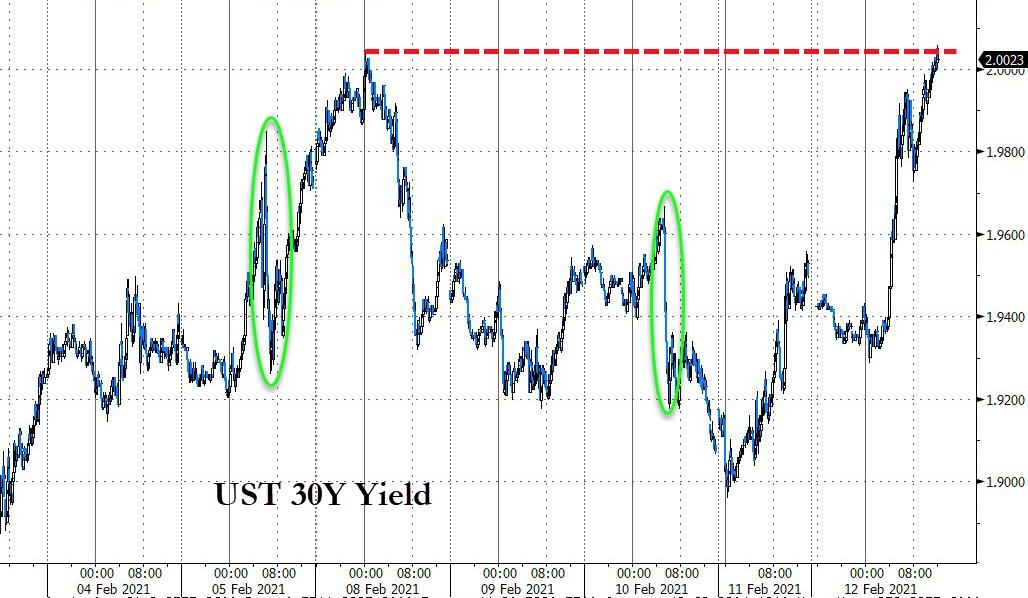
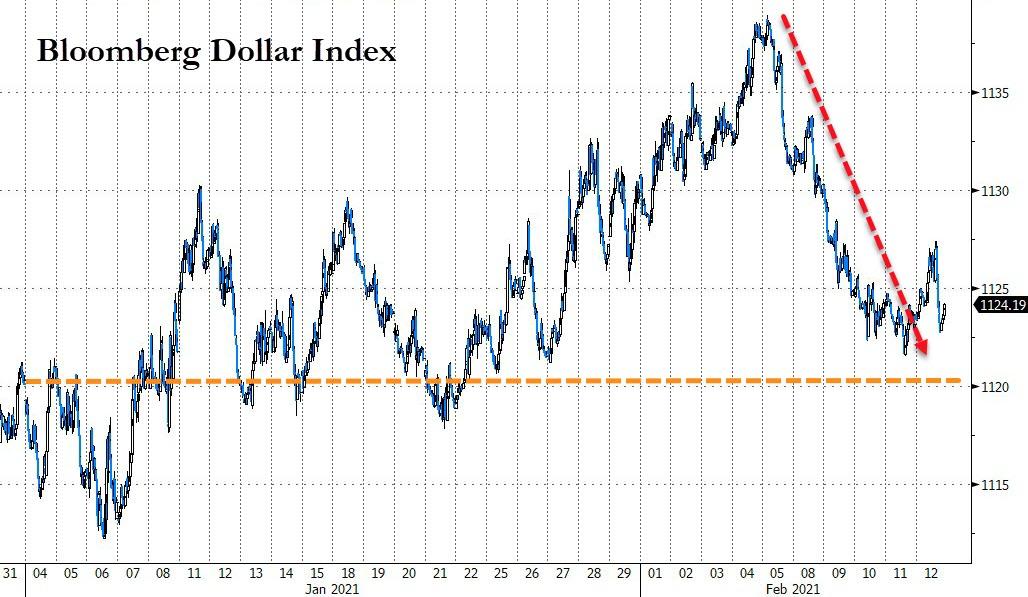
What kept the markets in check for most of the session were rising bond yields in the 10- and 30-year arena, thereby affecting gold negatively. Even though the US Dollar has been sliding for the past week or so, today it bounced moderately but enough to keep gold from recovering.
Despite the 4-day slowdown, today’s rally into close bodes well for Monday’s opening.
2. ETFs in the Spotlight
In case you missed the announcement and description of this section, you can read it here again.
It features some of the 10 broadly diversified domestic and sector ETFs from my HighVolume list as posted every Saturday. Furthermore, they are screened for the lowest MaxDD% number meaning they have been showing better resistance to temporary sell offs than all others over the past year.
The below table simply demonstrates the magnitude with which these ETFs are fluctuating above or below their respective individual trend lines (%+/-M/A). A break below, represented by a negative number, shows weakness, while a break above, represented by a positive percentage, shows strength.
For hundreds of ETF choices, be sure to reference Thursday’s StatSheet.
For this current domestic “Buy” cycle, here’s how some our candidates have fared:
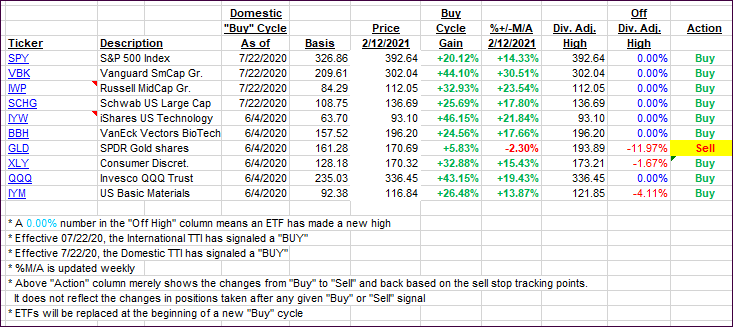
Click image to enlarge.
Again, the %+/-M/A column above shows the position of the various ETFs in relation to their respective long-term trend lines, while the trailing sell stops are being tracked in the “Off High” column. The “Action” column will signal a “Sell” once the -8% point has been taken out in the “Off High” column. For more volatile sector ETFs, the trigger point is -10%.
3. Trend Tracking Indexes (TTIs)
Our TTIs slipped, as we headed into the weekend.
This is how we closed 2/12/2021:
Domestic TTI: +18.63% above its M/A (prior close +19.13%)—Buy signal effective 07/22/2020.
International TTI: +17.58% above its M/A (prior close +18.20%)—Buy signal effective 07/22/2020.
Disclosure: I am obliged to inform you that I, as well as my advisory clients, own some of the ETFs listed in the above table. Furthermore, they do not represent a specific investment recommendation for you, they merely show which ETFs from the universe I track are falling within the specified guidelines.
———————————————————-
WOULD YOU LIKE TO HAVE YOUR INVESTMENTS PROFESSIONALLY MANAGED?
Do you have the time to follow our investment plans yourself? If you are a busy professional who would like to have his portfolio managed using our methodology, please contact me directly or get more details here.
———————————————————
Back issues of the ETF Tracker are available on the web.
Contact Ulli