
- Moving the markets
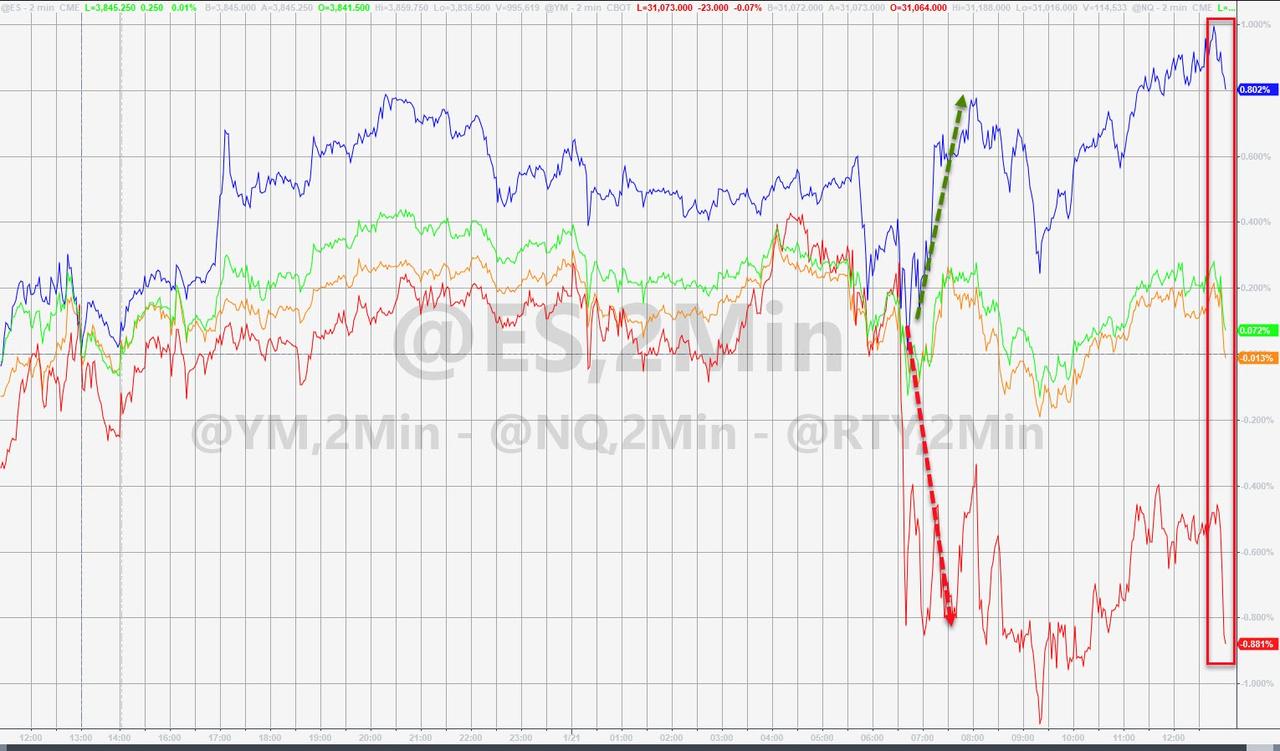
After yesterday’s euphoric dash to all-time highs, the futures continued their relentless march higher, still boosted by optimism that a giant wave of fiscal spending will not only power corporate earnings but also revive, or rather rescue, economic growth.
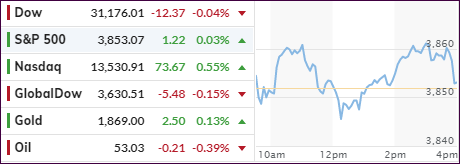
However, that reckless enthusiasm was tempered somewhat during the regular session with the major indexes riding the range and closing just about unchanged. Despite clinging to the unchanged line, the Nasdaq and S&P managed to eke out another record.
The tech sector has been the big dog over the past couple of sessions, with the Nasdaq powering ahead by +0.55%, thereby clearly outperforming SmallCaps (IWO), which surrendered -0.81% on the day.
Of course, the vaccine story remains in the headlines:
Equities closed at record highs in the previous session as President Joe Biden was sworn into office, ushering in hope that an improved vaccine rollout will ensure a smoother and faster reopening. Some on Wall Street are optimistic that Biden’s plans to combat the pandemic will give the stock market a further boost through 2021.
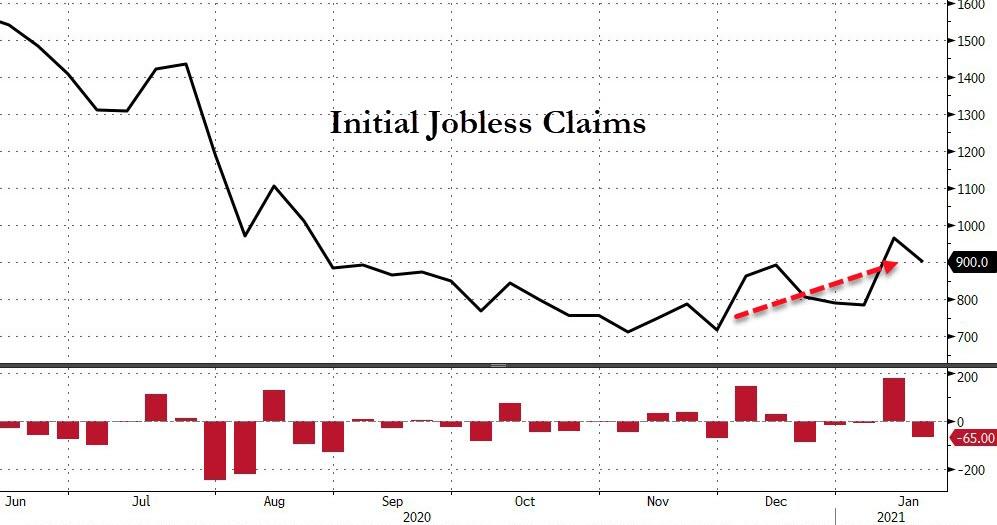
On the economic front, things continue to look dicey in the employment arena. We learned that 900k Americans filed for first-time unemployment benefits last week, which is at 4-month highs. While that is below the expected 935k number, it is nevertheless a horrific stat.
It’s hard to say whether theses consistently bad numbers point to trouble on the horizon, but they pretty much assure us ongoing central bank interventions and more stimulus programs.
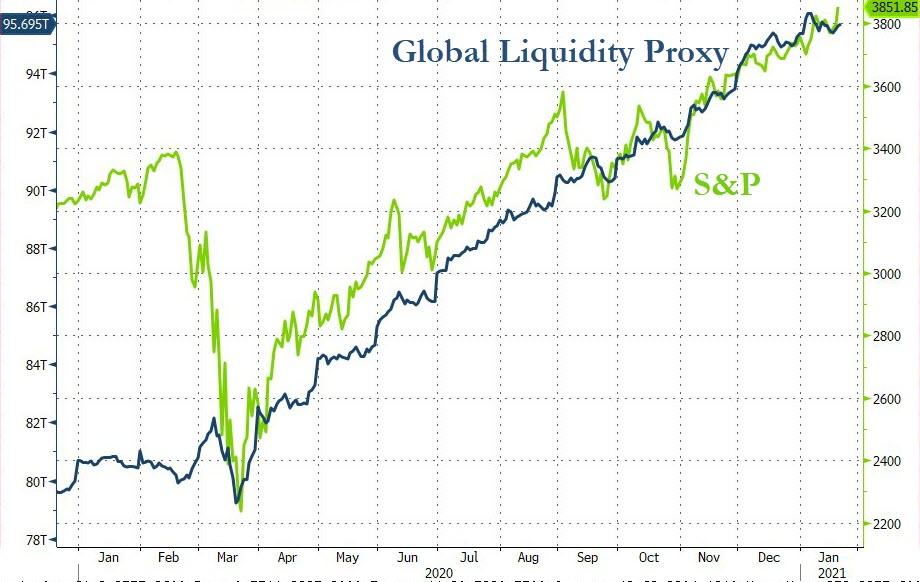
Tweeted my favorite analyst Sven Henrich:
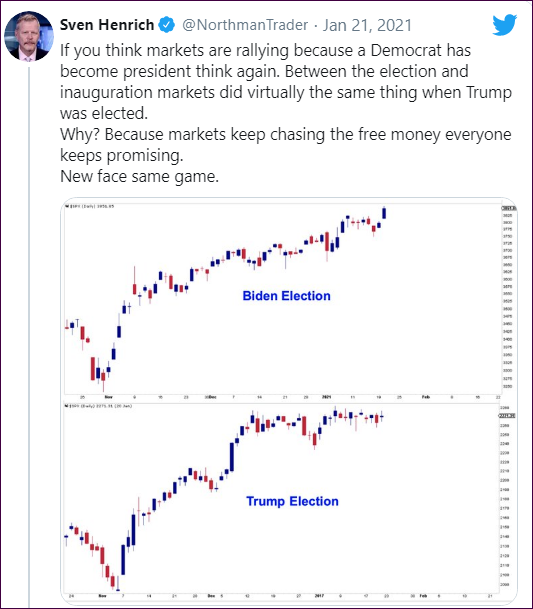
And there you have it from a different viewpoint. It’s not the economy that determines market direction—it’s the creation of “free” money, also known as global liquidity, which powers the investment universe.
2. ETFs in the Spotlight
In case you missed the announcement and description of this section, you can read it here again.
It features some of the 10 broadly diversified domestic and sector ETFs from my HighVolume list as posted every Saturday. Furthermore, they are screened for the lowest MaxDD% number meaning they have been showing better resistance to temporary sell offs than all others over the past year.
The below table simply demonstrates the magnitude with which these ETFs are fluctuating above or below their respective individual trend lines (%+/-M/A). A break below, represented by a negative number, shows weakness, while a break above, represented by a positive percentage, shows strength.
For hundreds of ETF choices, be sure to reference Thursday’s StatSheet.
For this current domestic “Buy” cycle, here’s how some our candidates have fared:
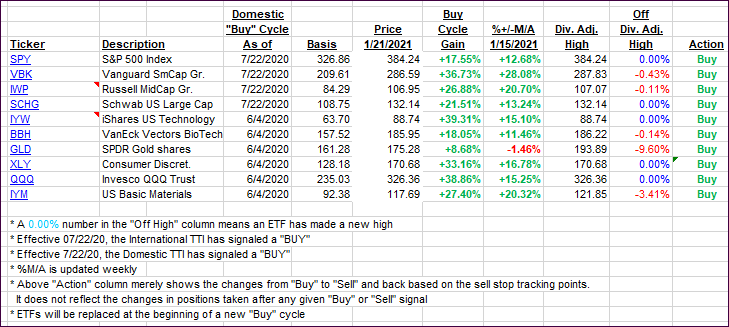
Click image to enlarge.
Again, the %+/-M/A column above shows the position of the various ETFs in relation to their respective long-term trend lines, while the trailing sell stops are being tracked in the “Off High” column. The “Action” column will signal a “Sell” once the -8% point has been taken out in the “Off High” column. For more volatile sector ETFs, the trigger point is -10%.
3. Trend Tracking Indexes (TTIs)
Our TTIs slipped as the markets rode the range.
This is how we closed 1/21/2021:
Domestic TTI: +20.01% above its M/A (prior close +20.62%)—Buy signal effective 07/22/2020.
International TTI: +19.42% above its M/A (prior close +19.64%)—Buy signal effective 07/22/2020.
Disclosure: I am obliged to inform you that I, as well as my advisory clients, own some of the ETFs listed in the above table. Furthermore, they do not represent a specific investment recommendation for you, they merely show which ETFs from the universe I track are falling within the specified guidelines.
Contact Ulli