
ETF Tracker StatSheet
You can view the latest version here.
TRIPPING INTO THE WEEKEND
- Moving the markets
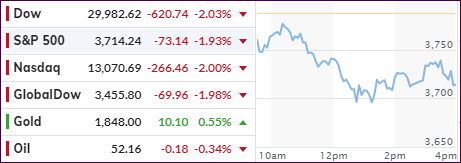
While the major indexes managed a green close yesterday, the Dow gave back about half of its early gains, but it could have been worse had it not been for the closing bell to “save” the markets from further declines.
And that is exactly what transpired, not only this morning but also during last night’s futures trading, namely that the rebound now appeared to have been a dead-cat-bounce with the sour mood continuing the entire session thus wiping out more than yesterday’s gains.
With options expiration lurking and the fallout from the GME short-squeeze debacle continuing, during which the once considered “untouchable” hedge funds’ short positions were squeezed to a degree never seen before, the battle raged on pushing up the stock another +67.9%. It is not known yet how many hedge funds had to be given a financial emergency enema, just to keep them alive.
It was the 6 million retail investors and their Robinhood accounts that unnerved the markets and made sure that the billionaire “hedgers” learned to use a little more discretion, by not shorting more than the entire market float, as they now have become intimately acquainted with the possible consequences of such actions.
As I pointed out 2 days ago, much of the selling in stocks and bonds was attributable to those hedge funds with outsized margin calls to sell everything they could to meet them—just to stay alive.
Added CNBC:
Shares of GameStop jumped 67.9% after Robinhood said it would allow limited buying of the stock and other heavily shorted names after restricting access the day before. Robinhood raised more than $1 billion from its existing investors overnight, in addition to tapping bank credit lines, to ensure it had the capital required to allow some trading again in volatile stocks like GameStop.
Investors are concerned that if GameStop continues to rise in such a volatile fashion, it may ripple through the financial markets, causing losses at brokers like Robinhood and forcing hedge funds who bet against the stock to sell other securities to raise cash.
For sure, fears have increased that this GameStop mania could be indicative of the market bubble I have talked about before, because none of the daily trading activities are a representation of the underlying economy, but merely a function of liquidity supported by the actions of the Fed. That may eventually contribute to more chaotic trading and possibly give the bearish crowd something to cheer about.
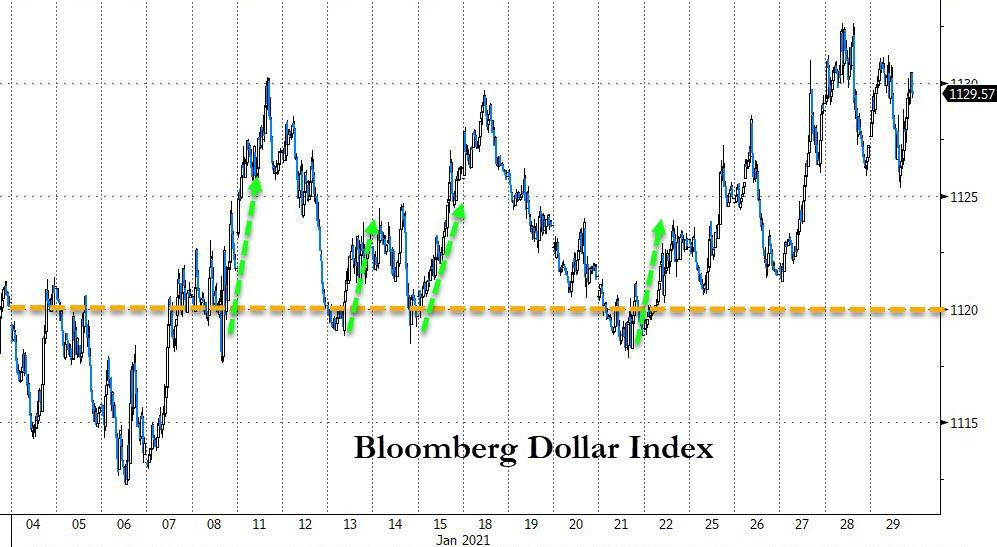
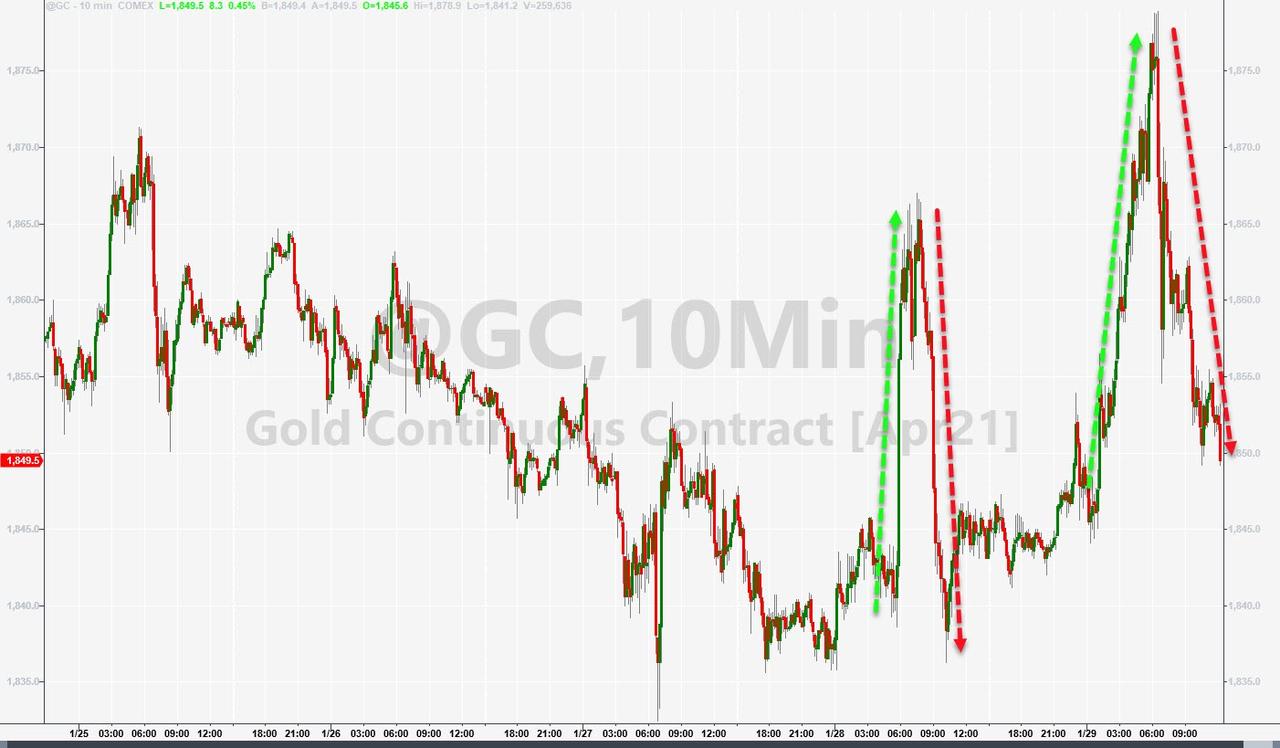
In the end, the markets scored their first losing month in four, with the Dow and S&P 500 dropping 2% and 1.1% respectively, but SmallCaps maintained their winning streak. The US Dollar scored its first monthly win since September, while Gold surged on various occasions, but every bounce was met with selling pressure, as ZH pointed out.
Yet, despite all this upheaval, panic and nervousness, the S&P 500 remains within 3.5% of its all-time highs. Go figure.
2. ETFs in the Spotlight
In case you missed the announcement and description of this section, you can read it here again.
It features some of the 10 broadly diversified domestic and sector ETFs from my HighVolume list as posted every Saturday. Furthermore, they are screened for the lowest MaxDD% number meaning they have been showing better resistance to temporary sell offs than all others over the past year.
The below table simply demonstrates the magnitude with which these ETFs are fluctuating above or below their respective individual trend lines (%+/-M/A). A break below, represented by a negative number, shows weakness, while a break above, represented by a positive percentage, shows strength.
For hundreds of ETF choices, be sure to reference Thursday’s StatSheet.
For this current domestic “Buy” cycle, here’s how some our candidates have fared:
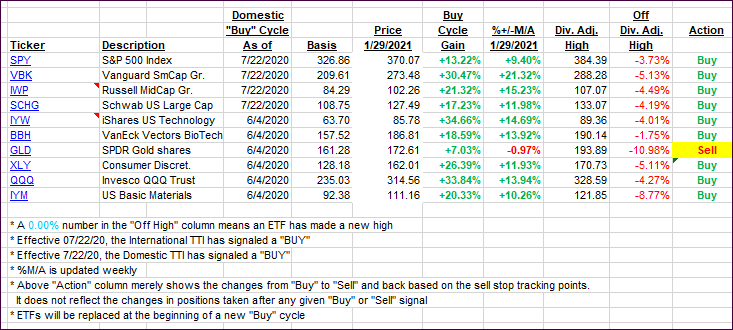
Click image to enlarge.
Again, the %+/-M/A column above shows the position of the various ETFs in relation to their respective long-term trend lines, while the trailing sell stops are being tracked in the “Off High” column. The “Action” column will signal a “Sell” once the -8% point has been taken out in the “Off High” column. For more volatile sector ETFs, the trigger point is -10%.
3. Trend Tracking Indexes (TTIs)
Our TTIs tumbled with the markets and are positioned as follows:
This is how we closed 1/29/2021:
Domestic TTI: +13.01% above its M/A (prior close +15.99%)—Buy signal effective 07/22/2020.
International TTI: +11.89% above its M/A (prior close +15.01%)—Buy signal effective 07/22/2020.
Disclosure: I am obliged to inform you that I, as well as my advisory clients, own some of the ETFs listed in the above table. Furthermore, they do not represent a specific investment recommendation for you, they merely show which ETFs from the universe I track are falling within the specified guidelines.
———————————————————-
WOULD YOU LIKE TO HAVE YOUR INVESTMENTS PROFESSIONALLY MANAGED?
Do you have the time to follow our investment plans yourself? If you are a busy professional who would like to have his portfolio managed using our methodology, please contact me directly or get more details here.
———————————————————
Back issues of the ETF Tracker are available on the web.
Contact Ulli