
- Moving the markets
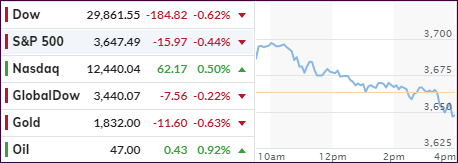
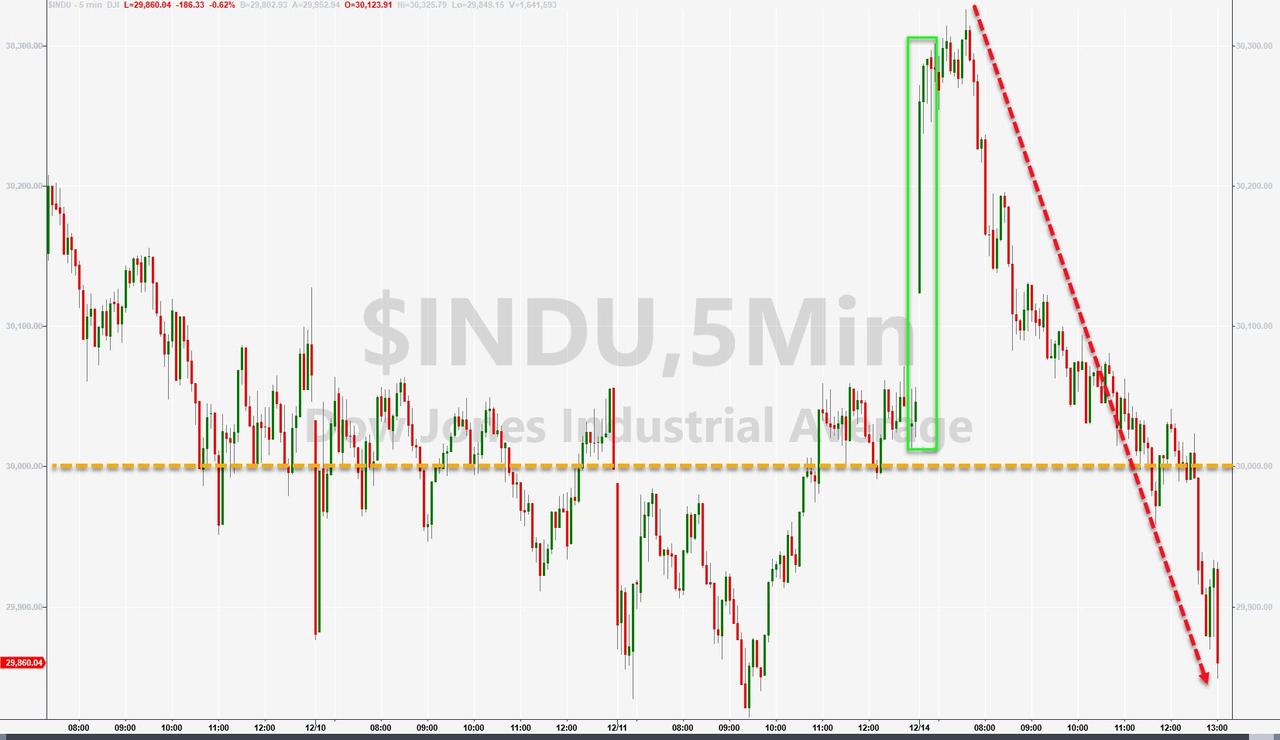
As solid early rally hit the skids, as the Dow performed a 330-point U-turn with two of the three major indexes closing in the red leaving only the Nasdaq above its unchanged line and sporting a +0.50% advance. As has been the case lately, SmallCaps outperformed but even that sector gave up part of a substantial early gain of over 2% to close with a more modest +0.84%.
While the vaccine rollout (V-day) continued full force to hundreds of distribution centers across the country, the first official dose was administered in New York. Offsetting that news were global and domestic headlines announcing and implementing the most stringent “full shutdowns” referred to as level 3.
For sure, the economic impact will be widely felt, with business closures accelerating, and eventually affecting markets, but some see the fallout to be modest:
“It is abundantly clear the economy is slowing as local shutdowns continue, but any impact on the equity market has been limited so far. Whether this continues into 1Q is unclear, but our guess is pullbacks will be limited unless something materially changes in the vaccine story,” Tavis McCourt, institutional equity strategist at Raymond James, told clients in a note.
In the meantime, the battle over a new stimulus package goes on, as key disagreements, such as state and local government aid, remain and have been the primary sticking points.
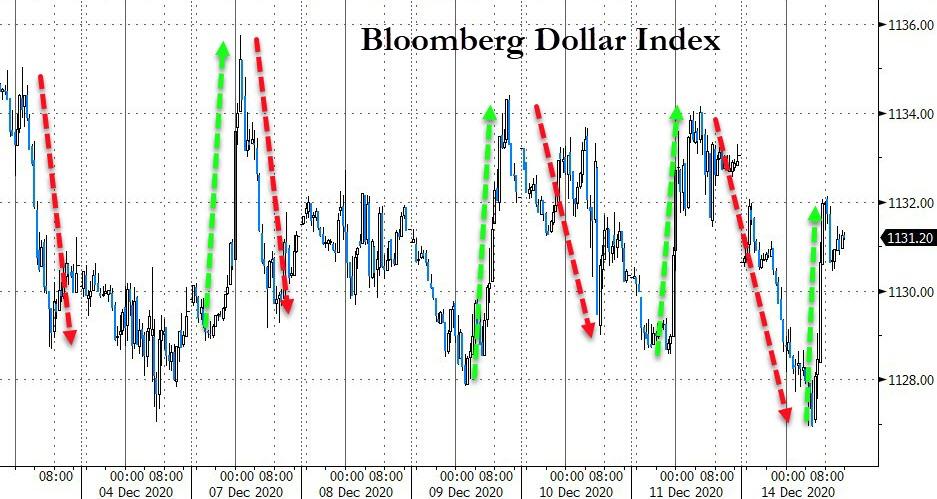
The flight to safety was on late in the session with the 30-year bond yield melting after an early rise, while the US Dollar dumped at the beginning and then spiked towards the close.
Tomorrow starts the second half of the month, which has been seasonally very strong, as Morgan Stanley points to in this 70-year chart.
We’ll have to wait and see if this time will be different—or not.
2. ETFs in the Spotlight
In case you missed the announcement and description of this section, you can again.
It features some of the 10 broadly diversified domestic and sector ETFs from my HighVolume list as posted every Saturday. Furthermore, they are screened for the lowest MaxDD% number meaning they have been showing better resistance to temporary sell offs than all others over the past year.
The below table simply demonstrates the magnitude with which these ETFs are fluctuating above or below their respective individual trend lines (%+/-M/A). A break below, represented by a negative number, shows weakness, while a break above, represented by a positive percentage, shows strength.
For hundreds of ETF choices, be sure to reference Thursday’s StatSheet.
For this current domestic “Buy” cycle, here’s how some our candidates have fared:
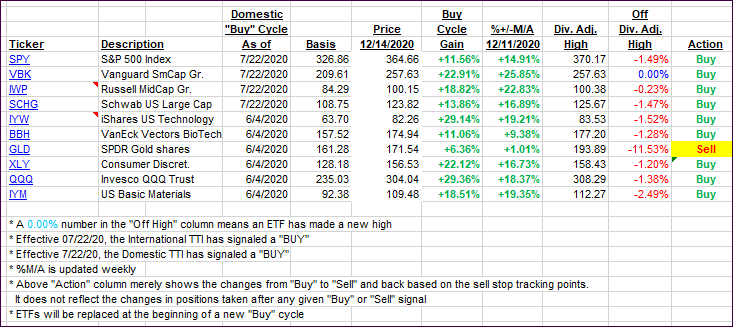
Click image to enlarge
Again, the %+/-M/A column above shows the position of the various ETFs in relation to their respective long-term trend lines, while the trailing sell stops are being tracked in the “Off High” column. The “Action” column will signal a “Sell” once the -8% point has been taken out in the “Off High” column. For more volatile sector ETFs, the trigger point is -10%.
3. Trend Tracking Indexes (TTIs)
Our TTIs pulled back a tad as the markets shifted into reversal mode.
This is how we closed 12/14/2020:
Domestic TTI: +19.35% above its M/A (prior close +20.21%)—Buy signal effective 07/22/2020
International TTI: +18.59% above its M/A (prior close +18.86%)—Buy signal effective 07/22/2020
Disclosure: I am obliged to inform you that I, as well as my advisory clients, own some of the ETFs listed in the above table. Furthermore, they do not represent a specific investment recommendation for you, they merely show which ETFs from the universe I track are falling within the specified guidelines.
Contact Ulli