
- Moving the markets
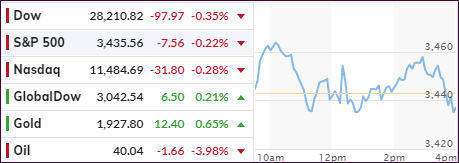
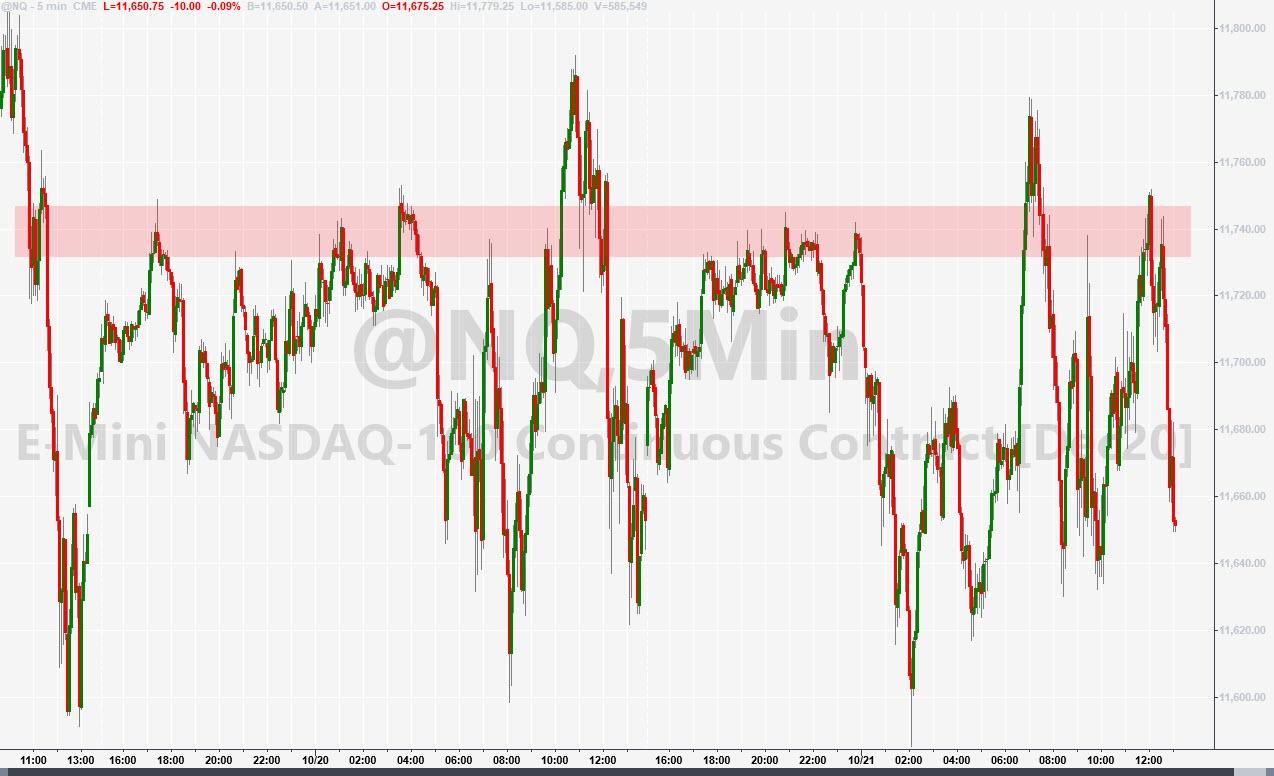
A roller coaster ride best describes today’s session with the markets homing in on every stimulus word uttered, then jumping on hopeful comments while slipping on disappointing news. Nothing else seemed to matter.
Goldman Sachs economist Alec Phillips noted that “the biggest issues remain unresolved and a deal doesn’t seem particularly close.”
“With big differences and little time, it seems unlikely that Pelosi and Mnuchin will reach a deal before the election. More importantly, even if a deal in principle is announced in coming days — this seems possible, but not likely — it looks very unlikely that it would pass before Election Day,” he added.
In the end, the major indexes dropped moderately, but gold stood out and solidified its position above the much fought for $1,900 level.
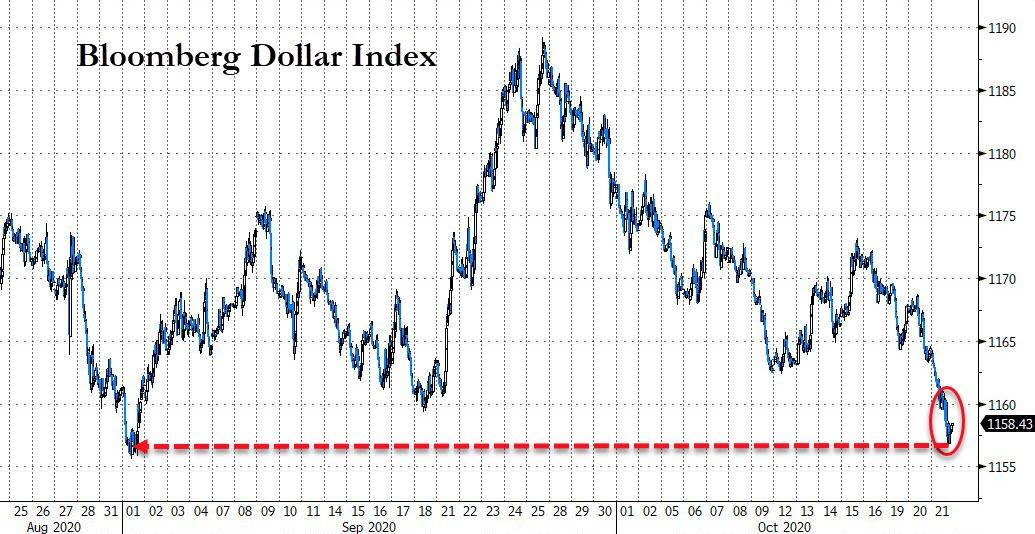
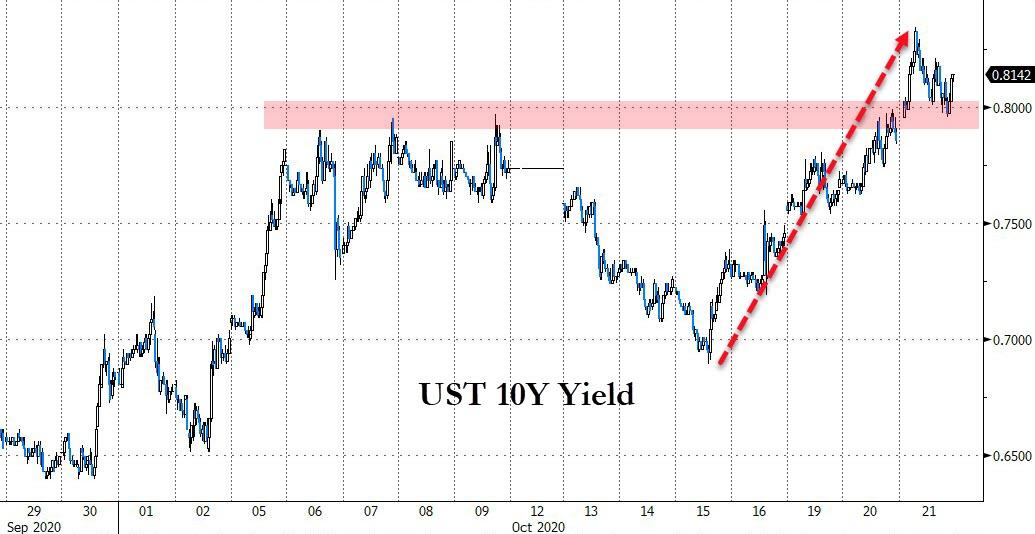
Other areas of the market were more active, as the US dollar was dumped to a level last seen on September 1st, while US bond yields rose for the 5th day in a row, as Bloomberg shows in this chart.
Added ZH:
Markets are currently not just pricing in an increase in volatility around Election Day, but also a sustained high-volatility environment thereafter – both in the post-election period and in the long run. Does that sound like an environment to be buying every dip at record highs?
That is exactly why we have reduced our exposure, since sharply increasing volatility on and after election day can wreak havoc with market sentiment.
2. ETFs in the Spotlight
In case you missed the announcement and description of this section, you can read it here again.
It features some of the 10 broadly diversified domestic and sector ETFs from my HighVolume list as posted every Saturday. Furthermore, they are screened for the lowest MaxDD% number meaning they have been showing better resistance to temporary sell offs than all others over the past year.
The below table simply demonstrates the magnitude with which these ETFs are fluctuating above or below their respective individual trend lines (%+/-M/A). A break below, represented by a negative number, shows weakness, while a break above, represented by a positive percentage, shows strength.
For hundreds of ETF choices, be sure to reference Thursday’s StatSheet.
For this current domestic “Buy” cycle, here’s how some our candidates have fared:
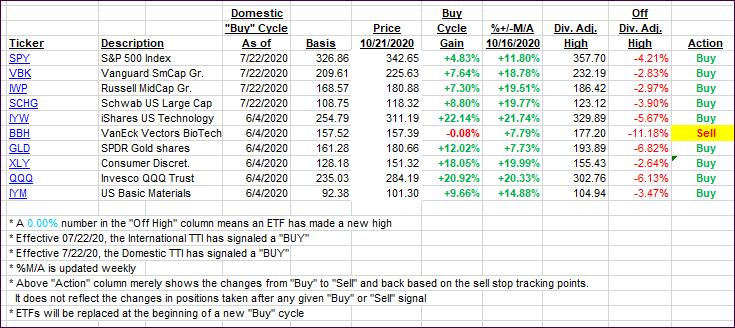
Click image to enlarge
Again, the %+/-M/A column above shows the position of the various ETFs in relation to their respective long-term trend lines, while the trailing sell stops are being tracked in the “Off High” column. The “Action” column will signal a “Sell” once the -8% point has been taken out in the “Off High” column. For more volatile sector ETFs, the trigger point is -10%.
3. Trend Tracking Indexes (TTIs)
Our TTIs pulled back slightly from yesterday’s close.
This is how we closed 10/21/2020:
Domestic TTI: +9.62% above its M/A (prior close +9.99%)—Buy signal effective 07/22/2020
International TTI: +6.27% above its M/A (prior close +6.42%)—Buy signal effective 07/22/2020
Disclosure: I am obliged to inform you that I, as well as my advisory clients, own some of the ETFs listed in the above table. Furthermore, they do not represent a specific investment recommendation for you, they merely show which ETFs from the universe I track are falling within the specified guidelines.
Contact Ulli