
- Moving the markets
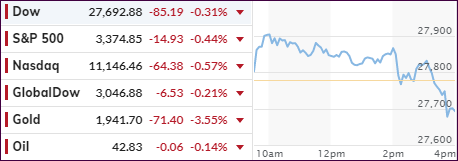
An early upswing ran into a brick wall, as the Fed minutes created uncertainty across the board. The Fed’s shying away from Yield Curve Control (YCC), where they allow interest rates to vacillate within a predetermined range, raises the risk of a potential hike in bond yields, which is not a positive for equities.
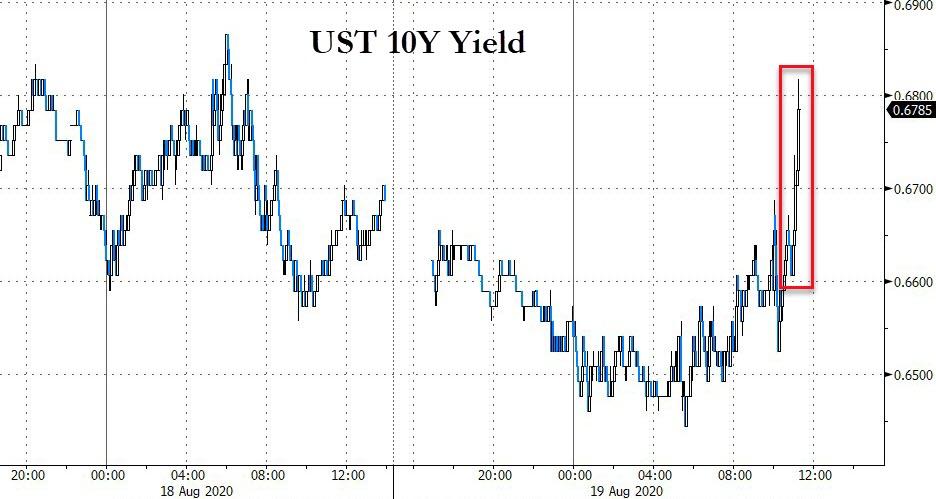
This also caused investors to dump bonds as yields rose, though not by huge amount but enough to reflect the disappointment due to YCC more or less having been expected.
As yields rose, the US dollar showed signs of life as well and rallied, while gold dropped sharply on the possibility of less monetary easing in the future. With that type of back and forth, gold has been riding the roller coaster recently depending on the latest news, but that can change in a hurry once the Fed money printers shift into overdrive.
ZH summed up the Fed’s minutes like this:
First, the Fed’s assessment of the economy was more downbeat than many had expected; second, the fact that the Fed appeared to cool substantially on any imminent (or even medium-term) implementation of yield curve control; third, the FOMC was silent on the prospect of changes to the size or composition of the central bank’s purchases of Treasury securities.
In other words, nothing was positive for any market, but tomorrow is another day and another chance for the S&P 500 to reclaim its old highs.
In the meantime, more volatility is likely, and we will rely on our trailing stops to determine if and when to exit a particular position.
2. ETFs in the Spotlight
In case you missed the announcement and description of this section, you can read it here again.
It features some of the 10 broadly diversified domestic and sector ETFs from my HighVolume list as posted every Saturday. Furthermore, they are screened for the lowest MaxDD% number meaning they have been showing better resistance to temporary sell offs than all others over the past year.
The below table simply demonstrates the magnitude with which these ETFs are fluctuating above or below their respective individual trend lines (%+/-M/A). A break below, represented by a negative number, shows weakness, while a break above, represented by a positive percentage, shows strength.
For hundreds of ETF choices, be sure to reference Thursday’s StatSheet.
For this current domestic “Buy” cycle, here’s how some our candidates have fared:
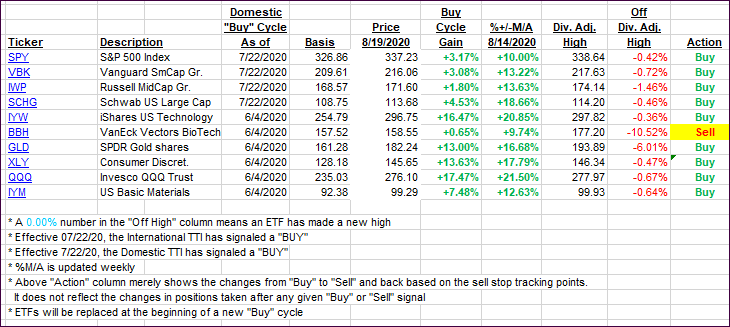
Click image to enlarge
Again, the %+/-M/A column above shows the position of the various ETFs in relation to their respective long-term trend lines, while the trailing sell stops are being tracked in the “Off High” column. The “Action” column will signal a “Sell” once the -8% point has been taken out in the “Off High” column. For more volatile sector ETFs, the trigger point is -10%.3.
3. Trend Tracking Indexes (TTIs)
Our TTIs slipped as all markets showed a downward bias.
This is how we closed 08/19/2020:
Domestic TTI: +6.45% above its M/A (prior close +6.86%)—Buy signal effective 07/22/2020
International TTI: +4.81% above its M/A (prior close +5.09%)—Buy signal effective 07/22/2020
Disclosure: I am obliged to inform you that I, as well as my advisory clients, own some of the ETFs listed in the above table. Furthermore, they do not represent a specific investment recommendation for you, they merely show which ETFs from the universe I track are falling within the specified guidelines.
Contact Ulli