
- Moving the markets
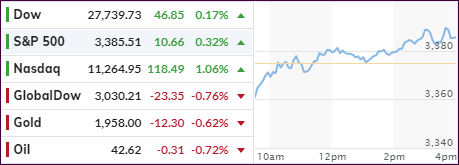
An initial dip for all major indexes turnout to be a non-event, as they dug themselves out of that early hole and closed in the green, with especially the Nasdaq showing a strong +1.06% gain.
The rebound from yesterday’s loss happened in the face of two economic reports that kept concerns about the sluggish recovery on the front burner. However, it motivated traders to continue with the time-tested strategy of buying tech, an approach that has served them well during the pandemic.
Despite hopes to the contrary, the number of people filing for unemployment rose again above the psychologically important 1 million mark:
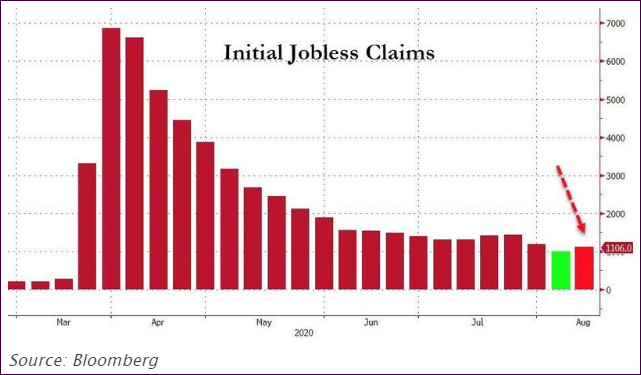
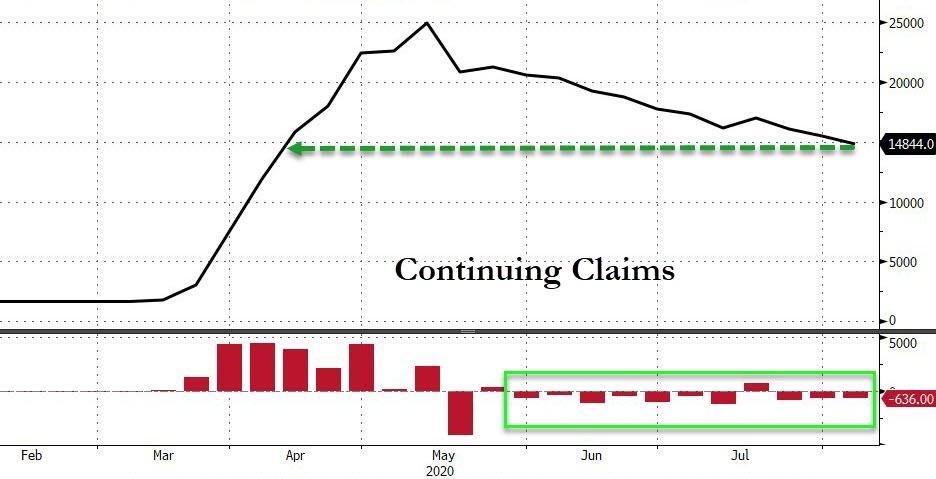
It dashed expectations of a lower number, namely 920k. However, with PPP having expired, this should not really be a surprise. On the positive side, Continuing Claims improved and settled back below 15 million.
The second econ report showed that a reading of business conditions fell to 17.2 in August from 24.1 in July, which should have tanked the markets—but did not.
Again, it seems that bad news is good news again and, while Congress still battles with stimulus issues, the markets simply rallied on the conviction that the Fed is committed to continue buying bonds and therefore keeping yields below a specific yet unknown level.
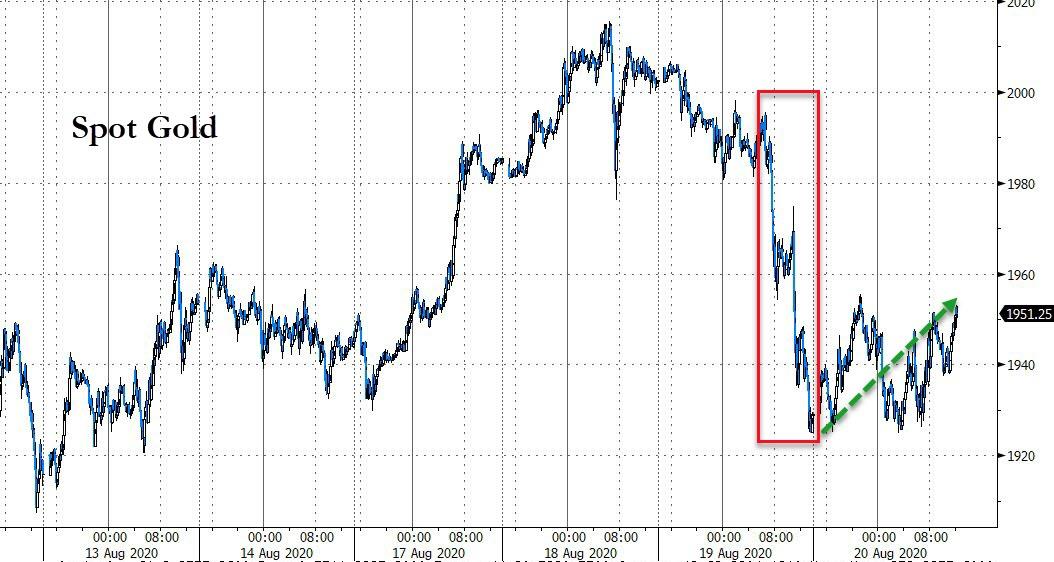
In the end, the major indexes recovered from yesterday’s pullback and even GLD managed a positive close after Wednesday’s spanking. Still, without further fiscal and monetary stimulus this economy is dead in the water, which means markets will need a new driver to continue ramping equities higher.
What could that be? Hmm, today I heard rumors that trade talks with China could be on deck again…
2. ETFs in the Spotlight
In case you missed the announcement and description of this section, you can read it here again.
It features some of the 10 broadly diversified domestic and sector ETFs from my HighVolume list as posted every Saturday. Furthermore, they are screened for the lowest MaxDD% number meaning they have been showing better resistance to temporary sell offs than all others over the past year.
The below table simply demonstrates the magnitude with which these ETFs are fluctuating above or below their respective individual trend lines (%+/-M/A). A break below, represented by a negative number, shows weakness, while a break above, represented by a positive percentage, shows strength.
For hundreds of ETF choices, be sure to reference Thursday’s StatSheet.
For this current domestic “Buy” cycle, here’s how some our candidates have fared:
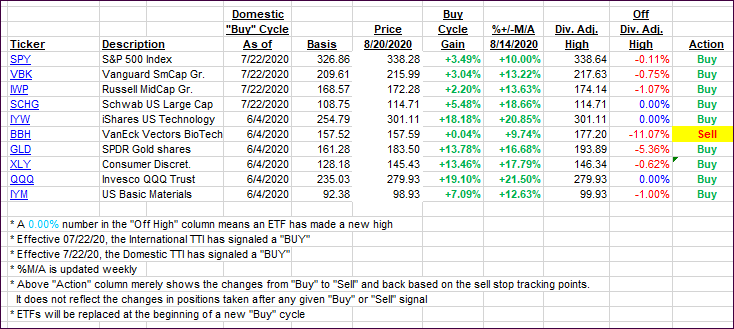
Click image to enlarge
Again, the %+/-M/A column above shows the position of the various ETFs in relation to their respective long-term trend lines, while the trailing sell stops are being tracked in the “Off High” column. The “Action” column will signal a “Sell” once the -8% point has been taken out in the “Off High” column. For more volatile sector ETFs, the trigger point is -10%.
3. Trend Tracking Indexes (TTIs)
Our TTIs slipped again as today’s rally had a narrow focus on predominantly tech.
This is how we closed 08/20/2020:
Domestic TTI: +5.95% above its M/A (prior close +6.45%)—Buy signal effective 07/22/2020
International TTI: +4.23% above its M/A (prior close +4.81%)—Buy signal effective 07/22/2020
Disclosure: I am obliged to inform you that I, as well as my advisory clients, own some of the ETFs listed in the above table. Furthermore, they do not represent a specific investment recommendation for you, they merely show which ETFs from the universe I track are falling within the specified guidelines.
Contact Ulli