
ETF Tracker StatSheet
You can view the latest version here.
A VOLATILE WEEK ENDS TO THE UPSIDE
- Moving the markets
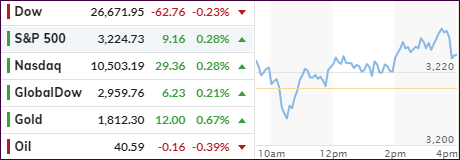
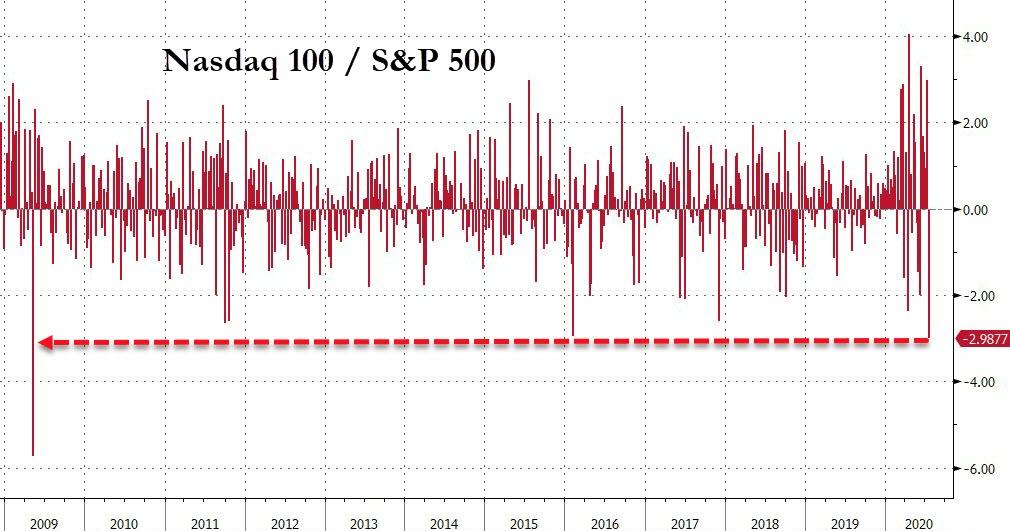
Volatility continued today, but in the end the Dow added some 2.5% for the week, the S&P 500 gained around 1%, while the Nasdaq skidded near -1.4% and suffered its worst weekly underperformance relative to the S&P 500 since 2009. This is minor when considering the Nasdaq’s YTD gain of some 22% vs. the SPY’s meager +0.99%.
The early bullish theme reversed, as the consumer sentiment index dropped to 73.2 from 78.1 vs. expectations of a rise to 78.6. Once again, the fallout from the virus continues to make itself felt, as activities are simply restricted blurring any forecasts especially those related to jobs.
For the day, the S&P 500 and Nasdaq climbed out of an early hole, while the Dow was the laggard by closing slightly in the red. It looks to me that the rise in Covid-19 cases has limited stock advances, and has overpowered optimism for further stimulus, at least for the time being.
Of course, a sudden or unexpected fiscal stimulus announcement will likely provide the bulls with more upside momentum, and I would expect such a move, should the “one-time” $600 unemployment bonus which is due to run out by the end of July, be extended.
On deck, and possibly having a far-reaching impact, is the 2-day summit of the EU’s 27 member states, which got underway this morning in Brussels. The subject will be a controversial 750 billion Euro recovery plan, which already face heavy resistance from fiscal conservatives in the bloc.
“Presumably, as is the way of Europe, they will agree to come back from more talks followed by a compromise and a watered-down deal,” Societe Generale’s Kit Juckes said of the EU discussions. “The positive though is that we are getting a recovery fund.”
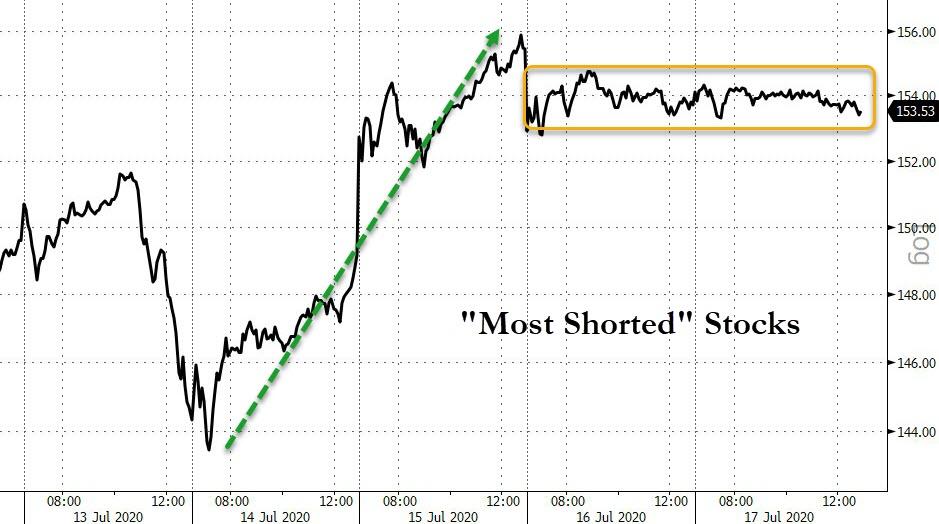
Back to the US. It’s interesting that, after being squeezed Tuesday and Wednesday, the shorts were ominously quiet, as ZH put it, and Bloomberg’s chart demonstrates. That is why the bullish moves over the past 2 days were muted and, with the Fed being quiet, caused some aimless meandering in the markets.
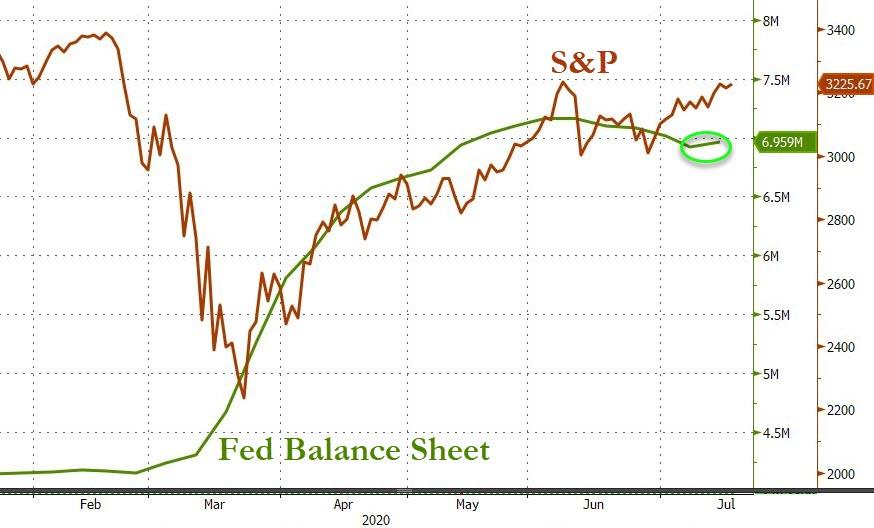
For sure, such sideways trending is bound to end, especially once the updated numbers come out again, showing that the Fed’s balance sheet has slightly reversed and is trending modestly upward again, as Bloomberg’s chart shows.
2. ETFs in the Spotlight
In case you missed the announcement and description of this section, you can read it here again.
It features some of the 10 broadly diversified domestic and sector ETFs from my HighVolume list as posted every Saturday. Furthermore, they are screened for the lowest MaxDD% number meaning they have been showing better resistance to temporary sell offs than all others over the past year.
The below table simply demonstrates the magnitude with which these ETFs are fluctuating above or below their respective individual trend lines (%+/-M/A). A break below, represented by a negative number, shows weakness, while a break above, represented by a positive percentage, shows strength.
For hundreds of ETF choices, be sure to reference Thursday’s StatSheet.
For this new domestic “Buy” cycle, which ended effective 6/25/2020, here’s how some our candidates have fared:

Click image to enlarge
Again, the %+/-M/A column above shows the position of the various ETFs in relation to their respective long-term trend lines, while the trailing sell stops are being tracked in the “Off High” column. The “Action” column will signal a “Sell” once the -8% point has been taken out in the “Off High” column. For more volatile sector ETFs, the trigger point is -10%.
3. Trend Tracking Indexes (TTIs)
Our TTIs followed the major indexes modestly higher. This is only the 3rd day of the TTIs hovering slightly above their respective trend lines. If this type of staying power remains, I will declare a new “Buy” sometime next week.
This is how we closed 07/17/2020:
Domestic TTI: +2.38% above its M/A (prior close +2.18%)—Sell signal effective 06/25/2020
International TTI: +1.29% above its M/A (prior close +1.23%)—Sell signal effective 02/26/2020
Disclosure: I am obliged to inform you that I, as well as my advisory clients, own some of the ETFs listed in the above table. Furthermore, they do not represent a specific investment recommendation for you, they merely show which ETFs from the universe I track are falling within the specified guidelines.
———————————————————-
WOULD YOU LIKE TO HAVE YOUR INVESTMENTS PROFESSIONALLY MANAGED?
Do you have the time to follow our investment plans yourself? If you are a busy professional who would like to have his portfolio managed using our methodology, please contact me directly or get more details here.
———————————————————
Back issues of the ETF Tracker are available on the web.
Contact Ulli