
ETF Tracker StatSheet
You can view the latest version here.
ENDING A VOLATILE WEEK ON A POSITIVE NOTE
- Moving the markets
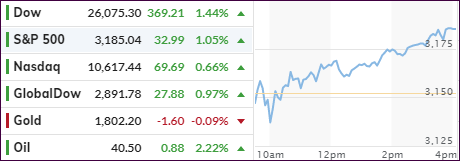
This morning we saw something highly unusual in the markets, namely that the Dow and S&P quickly stormed out of an early hole, with the Nasdaq lagging, something we have not seen in a while. However, when looking at the bigger picture, the tech sector index has been up 8 of the last 9 days and 17 of the last 20 days.
All 3 major indexes closed solidly in the green, but tech simply could not outshine the others today but nevertheless closed on the plus side of its unchanged line.
Despite the US seeing a record number of new Covid-19 infections, and some hospitals in California, Texas and other States reporting rising hospitalizations, traders remained unrattled and kept their focus on potential treatments.
Even the realities of the enormous June budget deficit elicited nothing more than a yawn from Wall Street, with MN Gordon from the EconomicPrism.com adding these comments:
The realities of the madness are too awful for most journalists to offer any real deep analysis. The U.S. budget deficit in June was $863 billion. For perspective, an annual budget deficit of $863 billion is enormously massive and fiscally unsustainable. Yet, now, the U.S. government has racked up $863 billion in debt, in just one month.
For additional perspective, the budget deficit for June 2019 was $8 billion. Hence, the deficit for June 2020 has increased 101x compared to June of last year. This, no doubt, is game overspending; desperate actions by a desperate government to keep this sucker from going down.
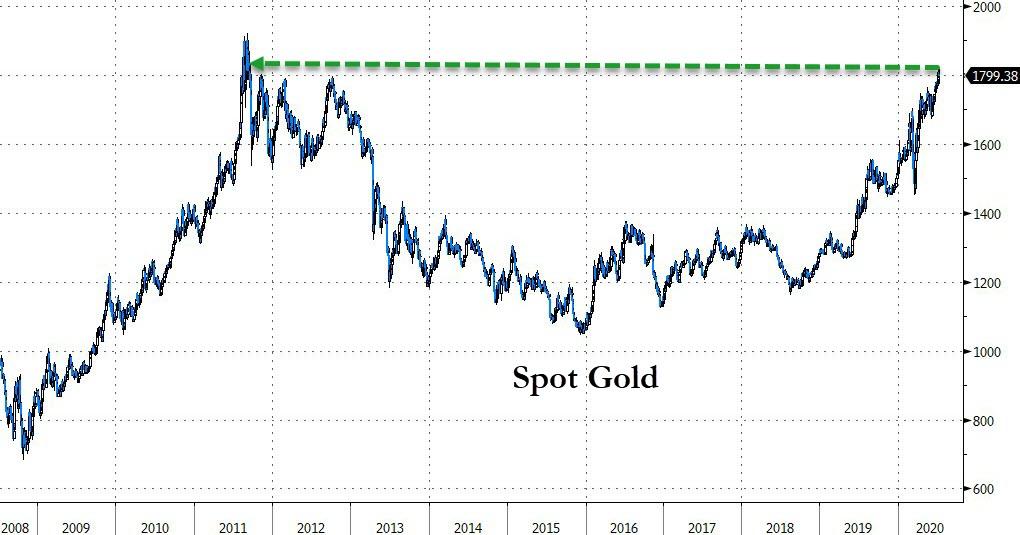
For sure, this may not be a problem right now, but it eventually will lead to an erosion of the dollar’s purchasing power, which is why I continue harping on the theme that anyone should own some gold to protect their assets against future dire consequences, namely inflation.
Despite giving back a little today, gold has been hanging on to its $1,800 level with spot gold having reached its highest point since 2011, as Bloomberg’s chart shows.
Our Trend Tracking Indexes (TTIs) made up some lost ground today, but still have not been able to conquer their respective trend lines. One of the reasons is that the TTIs are broad-based indicators, while the rebound of the past has been narrowly defined to only a few stocks, with all of them being part of the Nasdaq, hence the superiority of the tech sector.
2. ETFs in the Spotlight
In case you missed the announcement and description of this section, you can read it here again.
It features some of the 10 broadly diversified domestic and sector ETFs from my HighVolume list as posted every Saturday. Furthermore, they are screened for the lowest MaxDD% number meaning they have been showing better resistance to temporary sell offs than all others over the past year.
The below table simply demonstrates the magnitude with which these ETFs are fluctuating above or below their respective individual trend lines (%+/-M/A). A break below, represented by a negative number, shows weakness, while a break above, represented by a positive percentage, shows strength.
For hundreds of ETF choices, be sure to reference Thursday’s StatSheet.
For this new domestic “Buy” cycle, which ended effective 6/25/2020, here’s how some our candidates have fared:
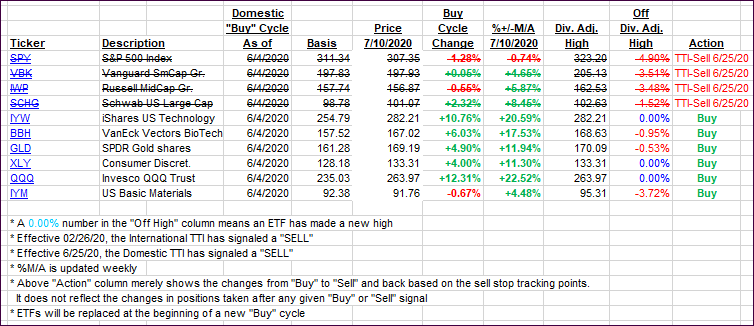
Click image to enlarge
Again, the %+/-M/A column above shows the position of the various ETFs in relation to their respective long-term trend lines, while the trailing sell stops are being tracked in the “Off High” column. The “Action” column will signal a “Sell” once the -8% point has been taken out in the “Off High” column. For more volatile sector ETFs, the trigger point is -10%.
3. Trend Tracking Indexes (TTIs)
Our TTIs recovered and improved relative to their respective trend line positions.
This is how we closed 07/10/2020:
Domestic TTI: -1.27% below its M/A (prior close -2.98%)—Sell signal effective 06/25/2020
International TTI: -1.12% below its M/A (prior close -2.19%)—Sell signal effective 02/26/2020
Disclosure: I am obliged to inform you that I, as well as my advisory clients, own some of the ETFs listed in the above table. Furthermore, they do not represent a specific investment recommendation for you, they merely show which ETFs from the universe I track are falling within the specified guidelines.
———————————————————-
WOULD YOU LIKE TO HAVE YOUR INVESTMENTS PROFESSIONALLY MANAGED?
Do you have the time to follow our investment plans yourself? If you are a busy professional who would like to have his portfolio managed using our methodology, please contact me directly or get more details here.
———————————————————
Back issues of the ETF Tracker are available on the web.
Contact Ulli