

- Moving the markets
It seemed like a tale of two markets with the Dow fluctuating wildly and ending at its lows of the day, while the Nasdaq never touched its unchanged line and powered back above its psychologically important 10k level, where it closed.
That was an important milestone to reach, and it took some 50 years to get there. It also shows some divergence, as technology more clearly has entered a bullish phase compared to the rest of the market.
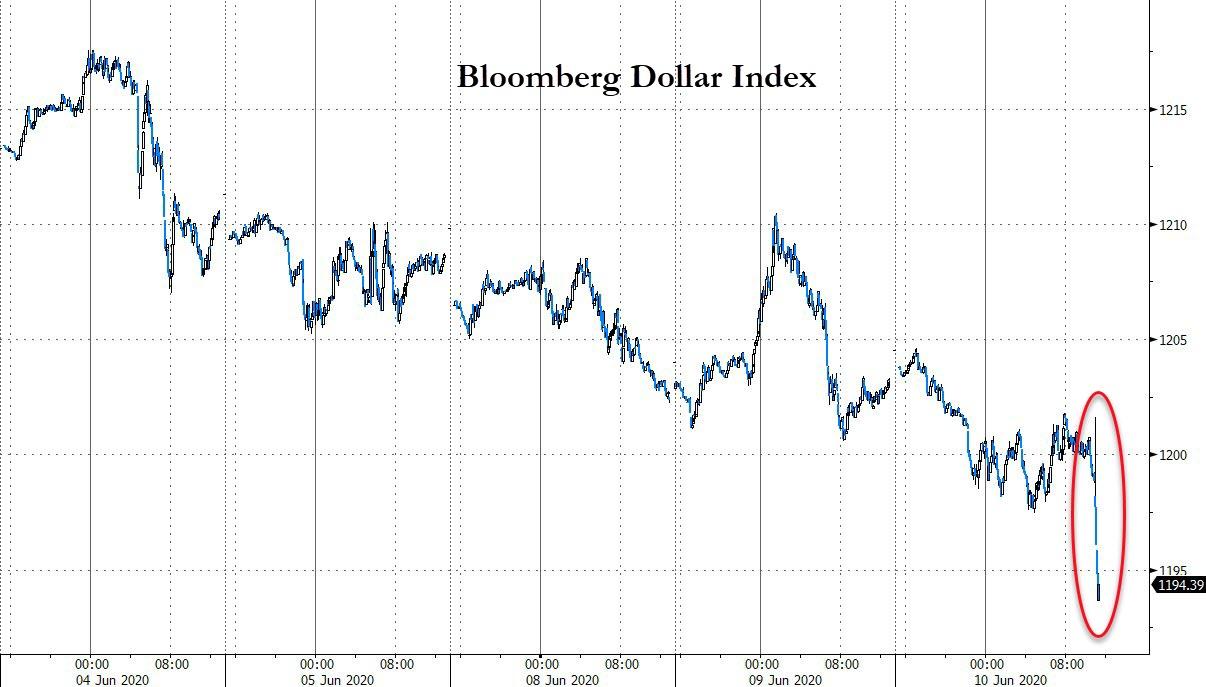
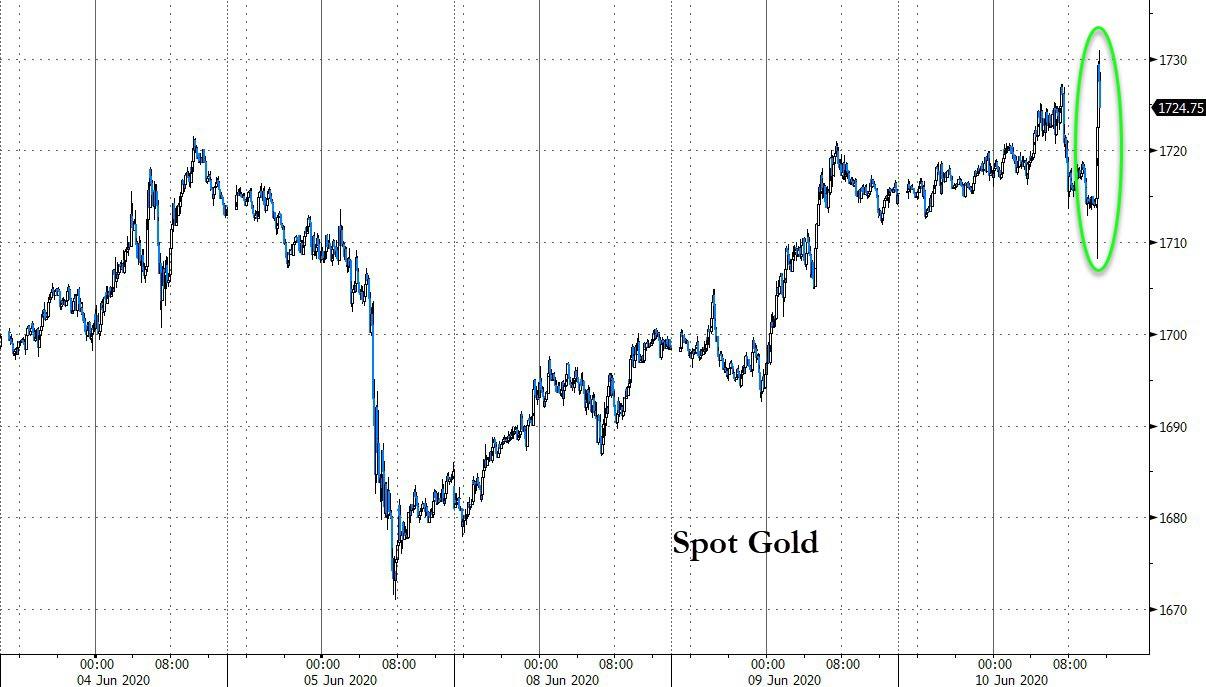
The Fed’s meeting came and went, and I consider its commitment of buying some $80 billion a month of Treasuries nothing but outright debt monetization, which is sure to create some concerns about the future of the dollar.
The fallout was instant, as the Dollar Index got hammered to its lowest since March while, as was to be expected, Gold surged.
Fed chief’s message was somewhat ambiguous, as ZH posted:
*POWELL: WE WANT INVESTORS TO PRICE IN RISK LIKE MARKETS SHOULD
*POWELL: POPPING ASSET BUBBLE WOULD HURT JOB-SEEKERS
While the major trend in the markets remains bullish, despite our Domestic Trend Tracking Index (TTI) coming off its high, there could be trouble ahead.
I repeat my warning: Do not be invested in this market unless you have a clearly defined exit strategy and are willing to execute it when it is triggered.
2. ETFs in the Spotlight
In case you missed the announcement and description of this section, you can read it here again.
It features some of the 10 broadly diversified domestic and sector ETFs from my HighVolume list as posted every Saturday. Furthermore, they are screened for the lowest MaxDD% number meaning they have been showing better resistance to temporary sell offs than all others over the past year.
The below table simply demonstrates the magnitude with which these ETFs are fluctuating above or below their respective individual trend lines (%+/-M/A). A break below, represented by a negative number, shows weakness, while a break above, represented by a positive percentage, shows strength.
For hundreds of ETF choices, be sure to reference Thursday’s StatSheet.
For this new domestic “Buy” cycle, which was effective 6/4/2020, here’s how some our candidates have fared:
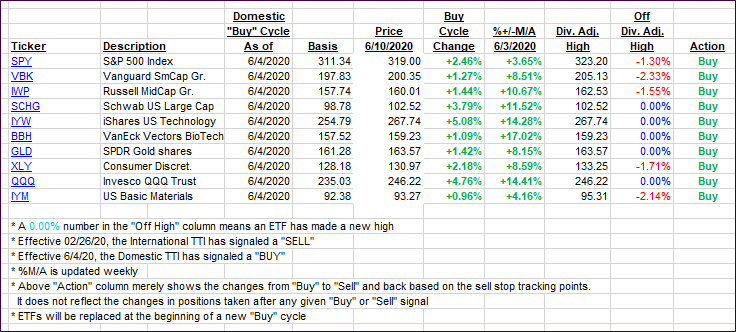
Click image to enlarge
Again, the %+/-M/A column above shows the position of the various ETFs in relation to their respective long-term trend lines, while the trailing sell stops are being tracked in the “Off High” column. The “Action” column will signal a “Sell” once the -8% point has been taken out in the “Off High” column. For more volatile sector ETFs, the trigger point is -10%.
3. Trend Tracking Indexes (TTIs)
Our TTIs headed south, as the major indexes, except for the Nasdaq, continued to show weakness. Good thing I was holding off on calling a new “Buy” in the international arena with the International TTI now having slipped back below its trend line.
It will need to cross above it and show some staying power before a new “Buy” will be triggered.
This is how we closed 06/10/2020:
Domestic TTI: +3.04% above its M/A (prior close +5.64%)—Buy signal effective 06/04/2020
International TTI: -0.37% below its M/A (prior close +0.44%)—Sell signal effective 02/26/2020
Disclosure: I am obliged to inform you that I, as well as my advisory clients, own some of the ETFs listed in the above table. Furthermore, they do not represent a specific investment recommendation for you, they merely show which ETFs from the universe I track are falling within the specified guidelines.
Contact Ulli