
ETF Tracker StatSheet
You can view the latest version here.
RIDING A ROLLERCOASTER INTO THE WEEKED
- Moving the markets
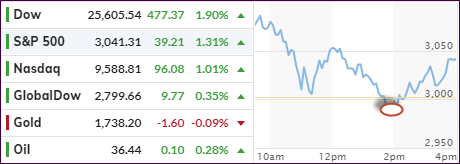
After yesterday’s drubbing, some sort of rebound was expected, and this is exactly what we got. However, an early 600-point gain in the Dow evaporated by mid-day with the major indexes briefly dipping into the red, before rebounding and closing the session with solid gains.
For sure, it was not enough to recoup yesterday’s losses, but at least we made a dent. Things looked shaky as the morning slide got underway, and I took the opportunity to lighten up on some of our more volatile holdings.
After all, we are still hovering slightly in bear market territory with our Domestic TTI having improved, but it is still stuck -2.04% below its long-term trend line.
That means we’re still in what I call the “neutral zone,” which is another way of saying that yesterday’s sharp drop could be an outlier, and the bullish trend might resume again. On the other hand, a new bearish scenario is not out of the question, so we must be prepared for either outcome. I have done that by reducing some of our exposure and am prepared to go to all “cash” if the need arises.
Traders were still trying to digest the details from Fed chief Powell’s news conference, with ZH providing this succinct summary:
Despite aggressive fiscal and monetary policy actions, risks abroad are skewed to the downside.
The future progression of the pandemic remains highly uncertain, with resurgence of the outbreak a substantial risk. In addition, the economic damage of the recession may be quite persistent.
The collapse in demand may ultimately bankrupt many businesses, thereby reducing business dynamism and innovation. Unlike past recessions, services activity has dropped more sharply than manufacturing – with restrictions on movement severely curtailing expenditures on travel, tourism, restaurants, and recreation – and social-distancing requirements and attitudes may further weigh on the recovery in these sectors. Disruptions to global trade may also result in a costly reconfiguration of global supply chains. Persistently weak consumer and firm demand may push medium- and longer-term inflation expectations well below central bank targets, particularly in regions with already low inflation at the onset of the recession.
Finally, additional expansionary fiscal policies – possibly in response to future large-scale outbreaks of COVID-19 – could significantly increase government debt and add to sovereign risk, especially for countries with already limited fiscal space.
These are not exactly market friendly observations, so we will have to see if more fallout will happen next week, or if the indexes follow the well-known but worn-out path of least resistance, namely dismissing negative news.
2. ETFs in the Spotlight
In case you missed the announcement and description of this section, you can read it here again.
It features some of the 10 broadly diversified domestic and sector ETFs from my HighVolume list as posted every Saturday. Furthermore, they are screened for the lowest MaxDD% number meaning they have been showing better resistance to temporary sell offs than all others over the past year.
The below table simply demonstrates the magnitude with which these ETFs are fluctuating above or below their respective individual trend lines (%+/-M/A). A break below, represented by a negative number, shows weakness, while a break above, represented by a positive percentage, shows strength.
For hundreds of ETF choices, be sure to reference Thursday’s StatSheet.
For this new domestic “Buy” cycle, which was effective 6/4/2020, here’s how some our candidates have fared:
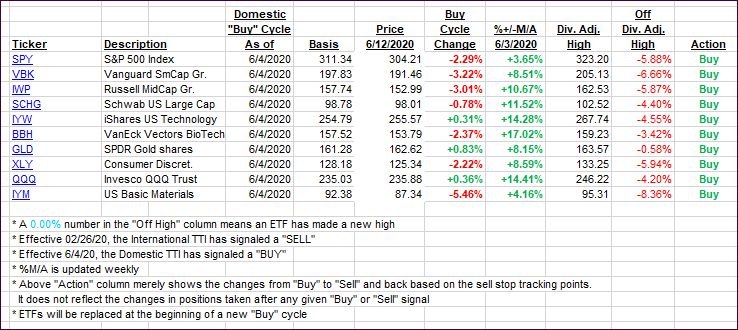
Click image to enlarge
Again, the %+/-M/A column above shows the position of the various ETFs in relation to their respective long-term trend lines, while the trailing sell stops are being tracked in the “Off High” column. The “Action” column will signal a “Sell” once the -8% point has been taken out in the “Off High” column. For more volatile sector ETFs, the trigger point is -10%.
3. Trend Tracking Indexes (TTIs)
Our TTIs improved as the major indexes were in roller-coaster mode throughout the session, but they closed solidly higher in the end. Our Domestic TTI is positioned close enough to its trend line that I will wait with issuing a “Sell” until we get more downside confirmation.
This is how we closed 06/12/2020:
Domestic TTI: -2.04% below its M/A (prior close -4.15%)—Buy signal effective 06/04/2020
International TTI: -4.85% below its M/A (prior close -5.46%)—Sell signal effective 02/26/2020
Disclosure: I am obliged to inform you that I, as well as my advisory clients, own some of the ETFs listed in the above table. Furthermore, they do not represent a specific investment recommendation for you, they merely show which ETFs from the universe I track are falling within the specified guidelines.
———————————————————-
WOULD YOU LIKE TO HAVE YOUR INVESTMENTS PROFESSIONALLY MANAGED?
Do you have the time to follow our investment plans yourself? If you are a busy professional who would like to have his portfolio managed using our methodology, please contact me directly or get more details here.
———————————————————
Back issues of the ETF Tracker are available on the web.
Contact Ulli