
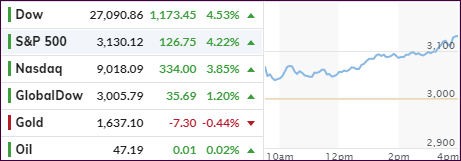
[Chart courtesy of MarketWatch.com]
- Moving the markets
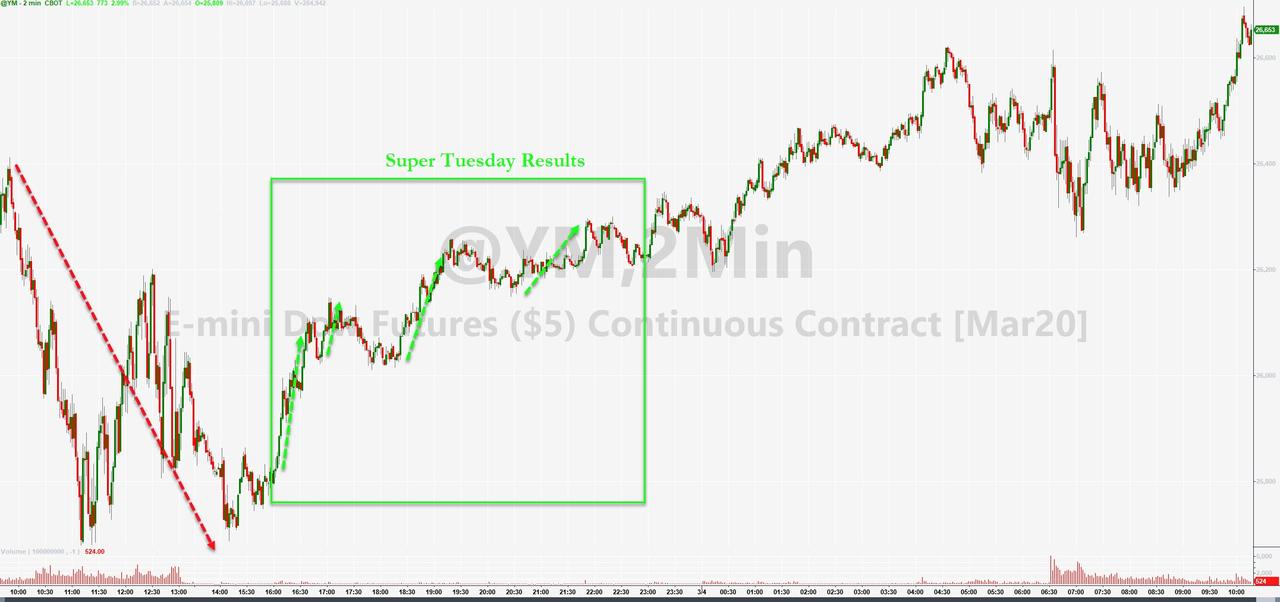
Despite the markets tanking yesterday, after the Fed surprise 0.5% interest rate cut, today we saw another bounce back, which in part may have been contributed by last night’s outcome of the Democratic primary vote.
Or, as one analyst quipped, maybe, just maybe, Biden’s gains mean Trump more likely to win…and that sent stocks higher?
Who knows, it also may have taken traders a day to warm up to the Fed’s surprise cut with today’s rebound more than recouping yesterday’s losses.
The bond market had another wild session with the 10-year yield predominantly trading below the 1% marker, before a late rally pushed the yield up by 4 basis points to close at 1.047%. However, at this point it appears that yields will be heading way below the 1% level.
But, traders are never satisfied when it comes to the level of interest rates, which means the market is now “demanding” almost 2 more rate-cuts, before the end of March, as this chart by Bloomberg shows.
Today’s move has pushed our main directional indicator, the Domestic Trend Tracking Index (TTI) back to within striking distance of a new “Buy” signal. Currently, we are only -0.95% away from the crossing of our long-term trend line into bullish territory.
Obviously, such a move would need to be accompanied by some staying power, before I will pull the trigger and ease back into domestic equity ETFs. The International TTI is lagging and about -3.20% away from turning bullish.
Stay tuned.
2. ETFs in the Spotlight
In case you missed the announcement and description of this section, you can again.
It features 10 broadly diversified and sector ETFs from my HighVolume list as posted every Saturday. Furthermore, they are screened for the lowest MaxDD% number meaning they have been showing better resistance to temporary sell offs than all others over the past year.
The below table simply demonstrates the magnitude with which some of the ETFs are fluctuating regarding their positions above or below their respective individual trend lines (%+/-M/A). A break below, represented by a negative number, shows weakness, while a break above, represented by a positive percentage, shows strength.
For hundreds of ETF choices, be sure to reference Thursday’s StatSheet.
For this past domestic “Buy” cycle, which ended on 2/27/2020, here’s how some our candidates have fared:
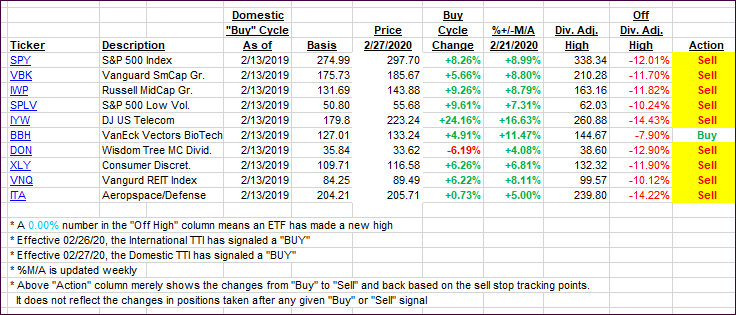
Click image to enlarge
Again, the %+/-M/A column above shows the position of the various ETFs in relation to their respective long-term trend lines, while the trailing sell stops are being tracked in the “Off High” column. The “Action” column will signal a “Sell” once the -8% point has been taken out in the “Off High” column. For more volatile sector ETFs, the trigger point is -10%.
3. Trend Tracking Indexes (TTIs)
Our TTIs recovered, as a positive fallout from the rate cut and some positive interpretations from last night’s Democratic primary combined to propel the major indexes.
Here’s how we closed 03/04/2020:
Domestic TTI: -0.95% below its M/A (prior close -4.70%)—Sell signal effective 02/27/2020
International TTI: -3.20% below its M/A (prior close -5.39%)—Sell signal effective 02/26/2020
Disclosure: I am obliged to inform you that I, as well as my advisory clients, own some of the ETFs listed in the above table. Furthermore, they do not represent a specific investment recommendation for you, they merely show which ETFs from the universe I track are falling within the specified guidelines.
Contact Ulli