
- Moving the markets
If you thought current market behavior is simply nuts with each rally being followed by a collapse, you are correct. Despite a slightly rising tendency, the major trend direction is anything but clear and can change on a dime the next day.
Today was no different, as the economic picture and the effects of the corona virus have clouded the markets by bouncing them around aimlessly like a rubber ball in a trampoline factory.
On a day-to-day basis, the tug-of-war in the markets has been, and will continue to be, headwinds vs. tailwinds with the former coming out ahead on negative virus news, while the latter will gain strength on any global stimulus reports.
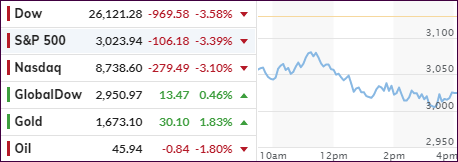
Some of this market action has been referred to as a super-puke with the Dow plunging about 1,000 points and bond yields collapsing to record lows. Demands for more Fed intervention exploded due the continuously worsening conditions in the overnight repo market.
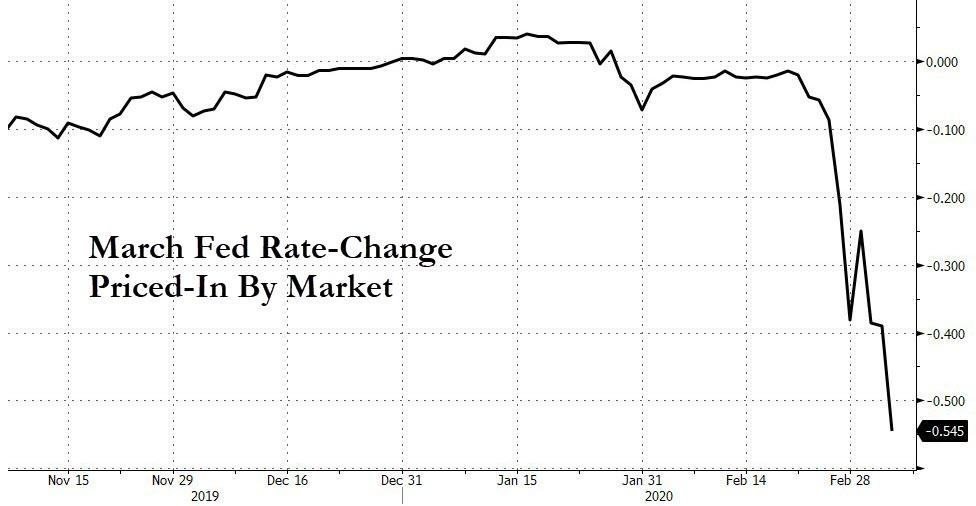
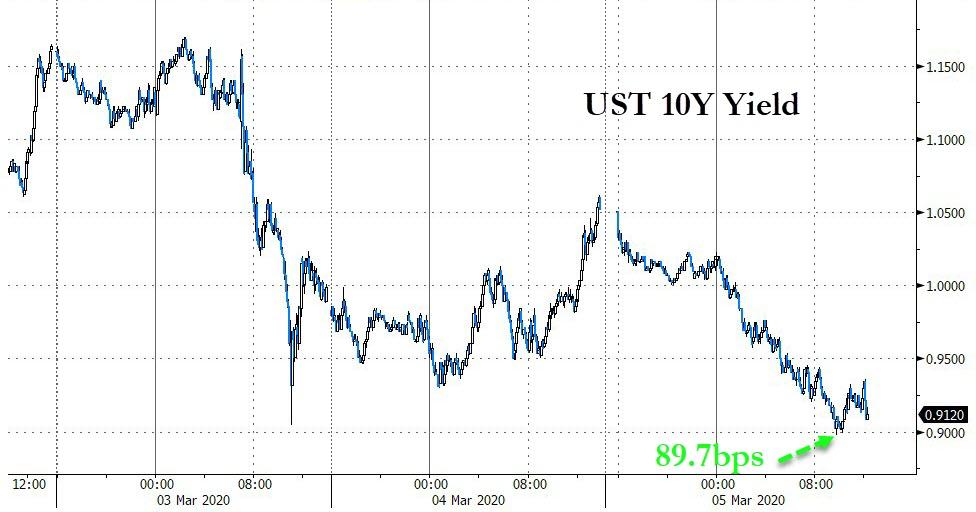
With equities seemingly panicking, another 0.5% rate cut in March is not only expected but also priced in, just to keep things afloat. As a result, the widely watched 10-year bond yield touched new record lows at 0.897% but rallied to close the first time ever below 1% (0.9120%).
Major trend direction is questionable at best, which is why we remain on the sidelines for the time being.
2. ETFs in the Spotlight
In case you missed the announcement and description of this section, you can again.
It features 10 broadly diversified and sector ETFs from my HighVolume list as posted every Saturday. Furthermore, they are screened for the lowest MaxDD% number meaning they have been showing better resistance to temporary sell offs than all others over the past year.
The below table simply demonstrates the magnitude with which some of the ETFs are fluctuating regarding their positions above or below their respective individual trend lines (%+/-M/A). A break below, represented by a negative number, shows weakness, while a break above, represented by a positive percentage, shows strength.
For hundreds of ETF choices, be sure to reference Thursday’s StatSheet.
For this past domestic “Buy” cycle, which ended on 2/27/2020, here’s how some our candidates have fared:
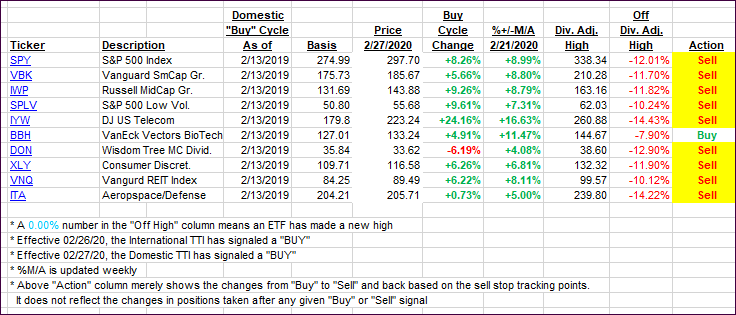
Click image to enlarge
Again, the %+/-M/A column above shows the position of the various ETFs in relation to their respective long-term trend lines, while the trailing sell stops are being tracked in the “Off High” column. The “Action” column will signal a “Sell” once the -8% point has been taken out in the “Off High” column. For more volatile sector ETFs, the trigger point is -10%.
3. Trend Tracking Indexes (TTIs)
Our TTIs joined the roller coaster ride and headed deeper into bearish territory.
Here’s how we closed 03/05/2020:
Domestic TTI: -4.49% below its M/A (prior close -0.95%)—Sell signal effective 02/27/2020
International TTI: -4.96% below its M/A (prior close -3.20%)—Sell signal effective 02/26/2020
Disclosure: I am obliged to inform you that I, as well as my advisory clients, own some of the ETFs listed in the above table. Furthermore, they do not represent a specific investment recommendation for you, they merely show which ETFs from the universe I track are falling within the specified guidelines.
Contact Ulli