
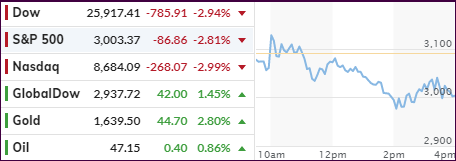
[Chart courtesy of MarketWatch.com]
- Moving the markets
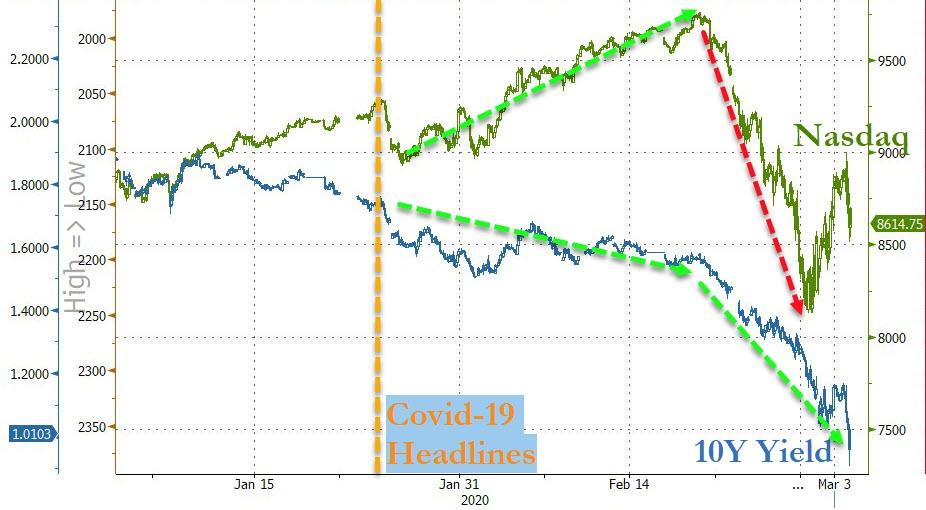
Despite the Fed’s attempt to please the markets by cutting interest rates a surprising 0.50%, an initial spike reversed and down we went, with the major indexes giving back a large chunk of yesterday’s gains.
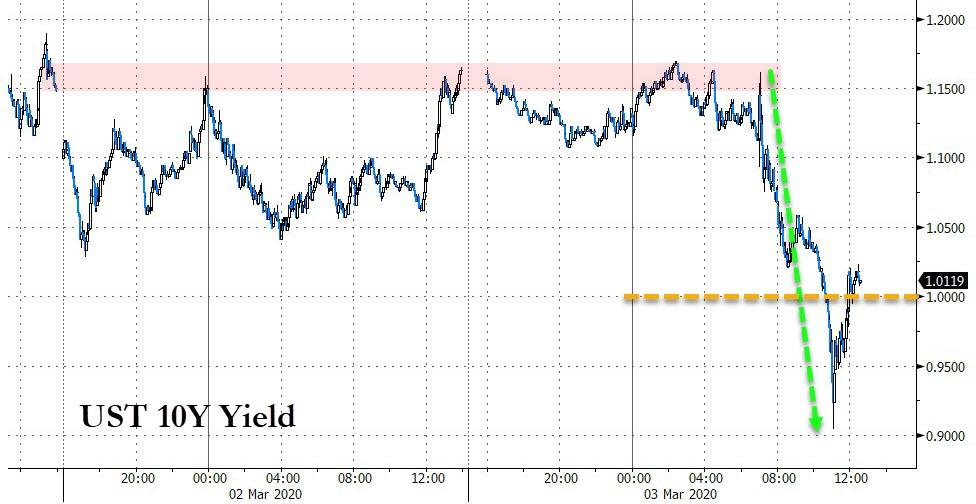
Bond yields skidded with the widely followed 10-year touching a 0-handle intra-day for the first time ever but closing slightly above at 1.007%.
The Fed’s reasoning for this emergency cut was that “we saw risk to the outlook for the economy and chose to act. I don’t think anybody knows how long it will be. I do know that the U.S. economy is strong.”
Of course, opinion vary widely as to the above wisdom and the view that the Fed is beholden to the markets. Here are some comments:
- Did the Fed just swing from omnipotence to impotence?
- The Fed cut rates, and the market dropped.
- What do they know?
- Did the Fed get an early glimpse of this week’s payroll data?
In the end, it appears that the Fed’s shock and awe rate reduction caused more turmoil than the intended reaction, namely calmness.
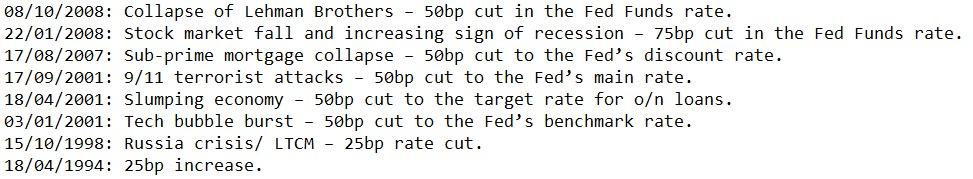
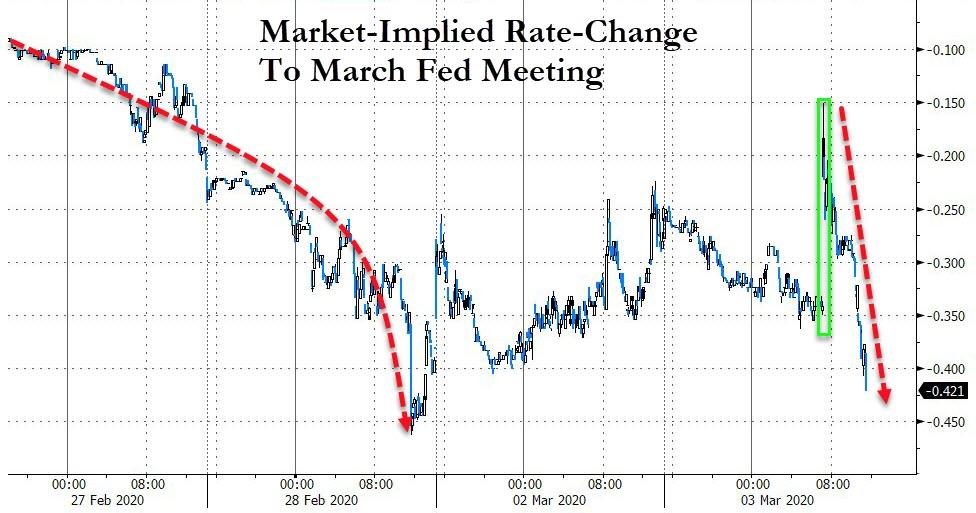
ZH pointed out that today’s cut was the largest since the fall of 2008 and just the ninth emergency rate cut in history. Despite all this, the markets still have priced in almost two more rate-cuts in March!
Does that mean that stocks will finally catch down to the reality of bonds?
It promises to be an interesting yet nerve wrecking time, and a good one to observe future developments from safety of the sidelines.
2. ETFs in the Spotlight
In case you missed the announcement and description of this section, you can again.
It features 10 broadly diversified and sector ETFs from my HighVolume list as posted every Saturday. Furthermore, they are screened for the lowest MaxDD% number meaning they have been showing better resistance to temporary sell offs than all others over the past year.
The below table simply demonstrates the magnitude with which some of the ETFs are fluctuating regarding their positions above or below their respective individual trend lines (%+/-M/A). A break below, represented by a negative number, shows weakness, while a break above, represented by a positive percentage, shows strength.
For hundreds of ETF choices, be sure to reference Thursday’s StatSheet.
For this past domestic “Buy” cycle, which ended on 2/27/2020, here’s how some our candidates have fared:
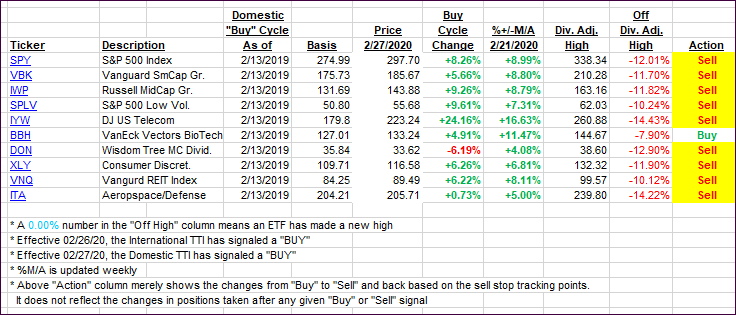
Click image to enlarge
Again, the %+/-M/A column above shows the position of the various ETFs in relation to their respective long-term trend lines, while the trailing sell stops are being tracked in the “Off High” column. The “Action” column will signal a “Sell” once the -8% point has been taken out in the “Off High” column. For more volatile sector ETFs, the trigger point is -10%.
3. Trend Tracking Indexes (TTIs)
Our TTIs plunged, as the Fed’s rate cut was causing more turmoil than good. We remain on the sidelines.
Here’s how we closed 03/03/2020:
Domestic TTI: -4.70% below its M/A (prior close -2.36%)—Sell signal effective 02/27/2020
International TTI: -5.39% below its M/A (prior close -4.33%)—Sell signal effective 02/26/2020
Disclosure: I am obliged to inform you that I, as well as my advisory clients, own some of the ETFs listed in the above table. Furthermore, they do not represent a specific investment recommendation for you, they merely show which ETFs from the universe I track are falling within the specified guidelines.
Contact Ulli